
Using Your Fundraiser Insights Dashboard
Note: Clarity’s Fundraiser Insights dashboard is a feature of Signal by EverTrue. If you have questions about Signal, please reach out to your Customer Success Manager (CSM).
Clarity’s Fundraiser Insights dashboard is designed to help fundraisers and their managers track the fundraiser's fiscal year performance, evaluate the health of their assigned portfolio, address any delayed proposals in the pipeline, and identify prospects in need of further engagement.
Below, we’ll take a closer look at the views and filters you can use to analyze and customize this dashboard’s data.
Dashboard Metrics
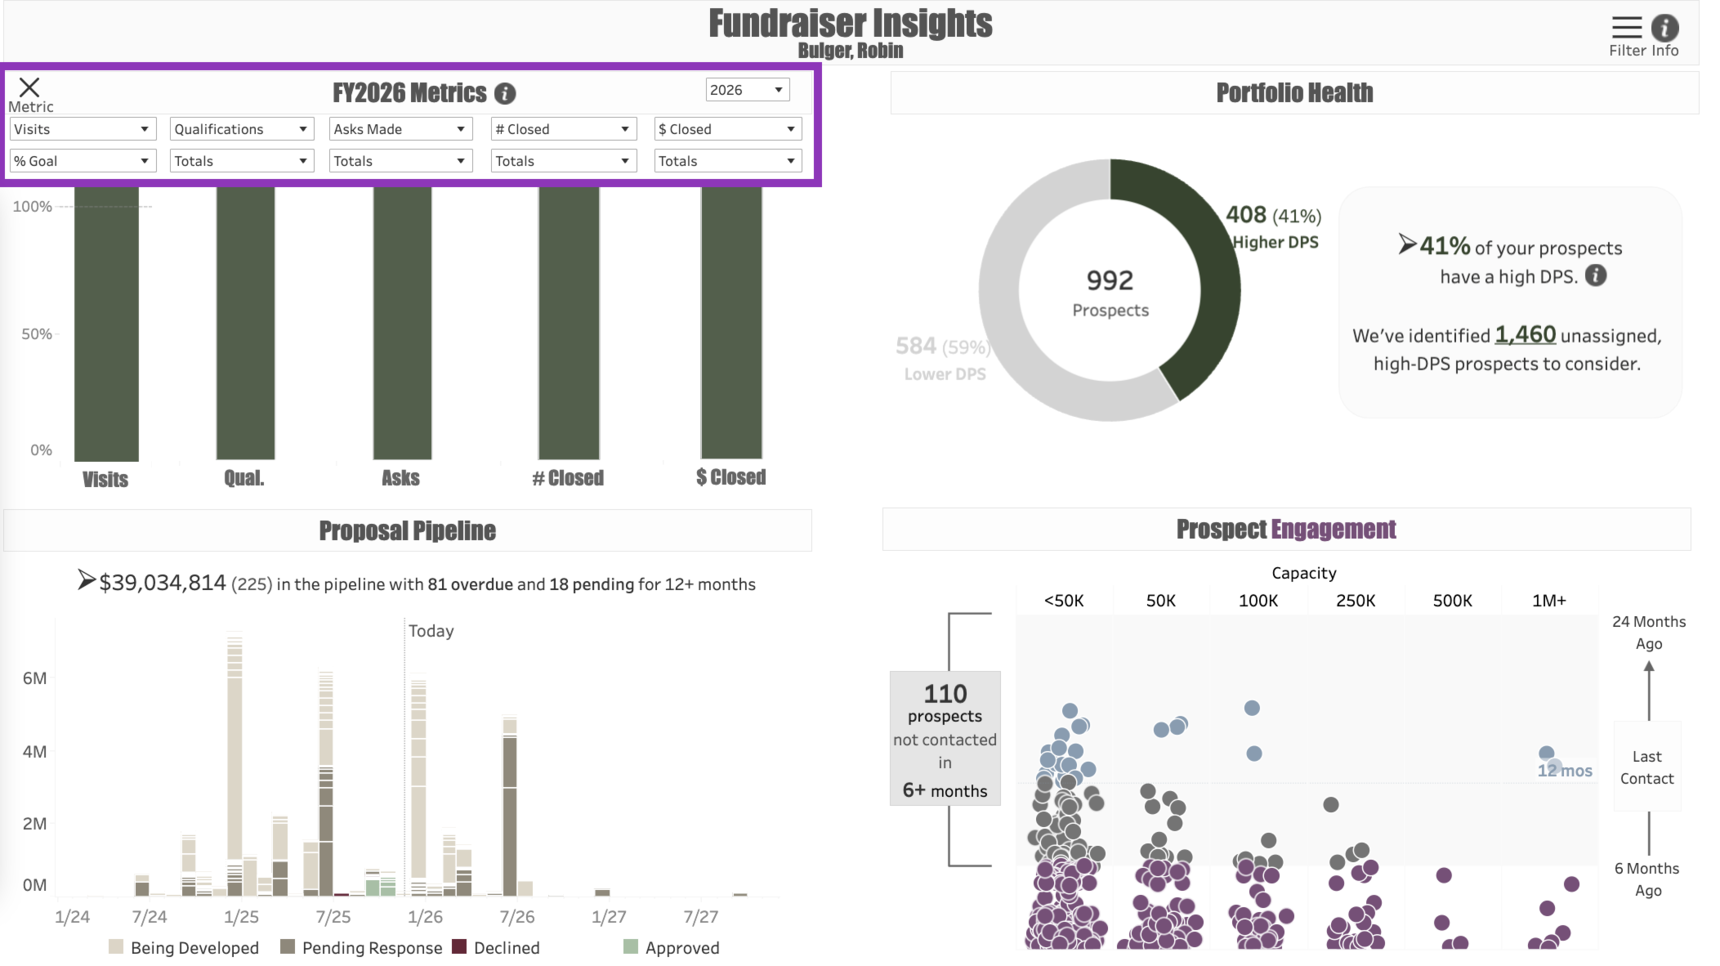
When you open the Fundraiser Insights dashboard, you will see a Metrics menu. Clicking there will allow you to choose the five metrics by which the fundraiser's performance will be measured:
Visits: This is a count of the number of Interactions the fundraiser has filed in the fiscal year that are either in-person or virtual meetings.
- Qualifications: Counts the number of Interactions the fundraiser has filed in the fiscal year with a Purpose code of either "Qualification" or "Discovery."
- Asks: Counts the number of prospects that the fundraiser has solicited within the year, as determined by a change in the Proposal stage. Note that the prospect need not have responded to the ask in order for the ask to be counted here.
- # Closed: Counts the number of Proposals that were successfully closed within the fiscal year.
- $ Closed: A total dollar value of all of the fundraiser's Proposals that were approved in the fiscal year.
- DX Meetings: Counts the number of meetings logged by a Digital Engagement Officer (DXO).
- DX Asks: Counts all of the asks completed by a DXO, whether they were substantive or passive solicitations.
- DX Substantive Asks: The total number of substantive asks made by a DXO.
Below each metric, you can choose whether to view the fundraiser's performance as a Total or a Percent to Goal. To view each metric as a percent to goal, your Signal administrator must first enter goals for each metric and each fundraiser. You can learn more about how to enter goals here.
Dashboard Views
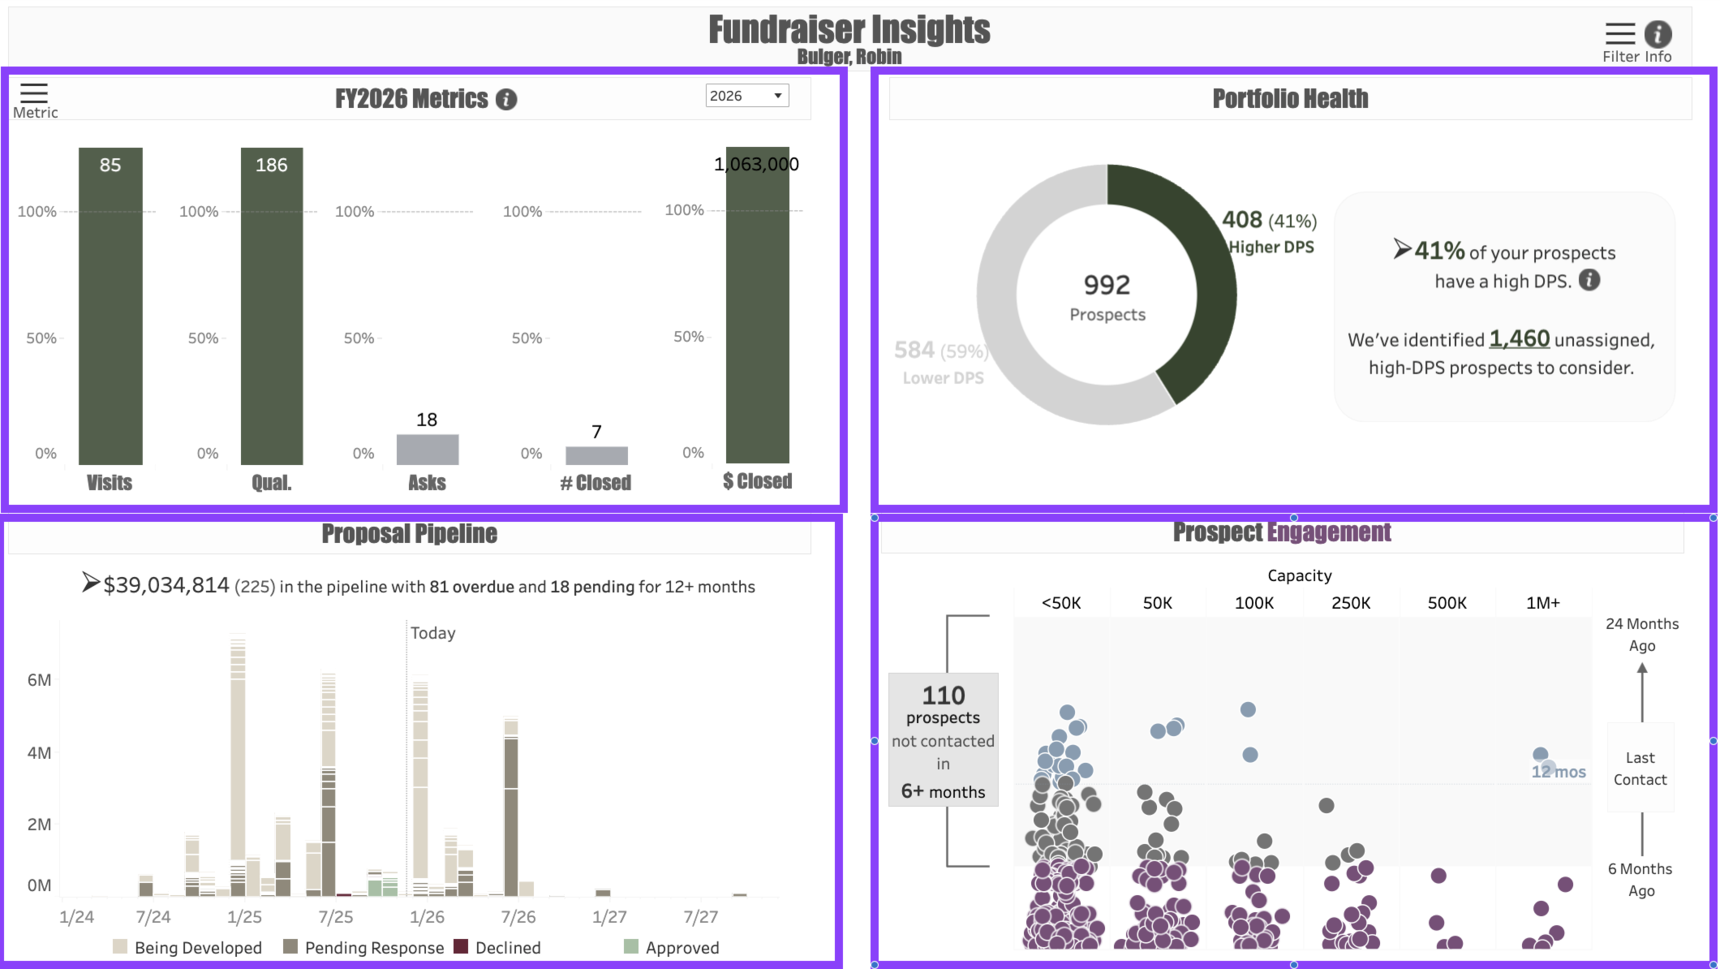
The Fundraiser Insights dashboard contains four views:
- FY Metrics: Tracks the fundraiser's overall fiscal year performance according to the fiscal year chosen in the menu at the upper right corner of the view.
- Portfolio Health: Shows the balance of high and low-DPS scoring prospects within the fundraiser's assigned portfolio. (To learn more about the DPS Score, click here.)
- Proposal Pipeline: Shows the Proposals assigned to the fundraiser that are either Being Developed or Pending a Prospect Response, along with any proposals that have been Approved or Declined within the fiscal year.
- Prospect Engagement: Displays how recently the fundraiser has filed an Interaction with each prospect in their portfolio. Each prospect is represented by a dot, with Purple representing the most recently-engaged prospects, Gray representing prospects who have not been contacted in at least six months, and Blue representing the prospects who have never been contacted.
To see a particular fundraiser's portfolio, click on the Filter in the upper right corner of the dashboard and choose the fundraiser's name.
Use Cases
Your dashboard views are interactive, made up of clickable and hoverable elements that enable thorough data analysis. Together, dashboard views and filters allow for endless experimentation, customization, and creativity.
Below, we offer a few ways you can strategically use the Fundraiser Insights dashboard, but we encourage you to spend time exploring the dashboard in your own time!
Understanding the Metrics: You're a fundraiser who is being measured on the number of Visits you have in a given fiscal year. You'd like to see which visits are being counted as part of your Metrics total.
- Addressing Overdue Proposals: You see that you have a lot of proposals that are overdue. You would like to begin addressing those, starting with the largest proposal in the pipeline.
- Engaging High-Capacity Prospects: You notice you have several high-capacity prospects in your portfolio who have never been engaged. You would like to begin adding them to your Signal Cadences beginning with those with the highest capacity ratings.
These are just some of the ways you can use the Fundraiser Insights dashboard to better understand your fundraising performance. Let us know how you’re using it!
For any other questions, reach out to EverTrue Support at genius@evertrue.com.
Reply
Content aside
- 8 mths agoLast active
- 32Views
-
1
Following