
Using Your Fundraising Analytics Dashboard
Note: Clarity’s Fundraising Analytics dashboard is a feature of Signal by EverTrue. If you have questions about Signal, please reach out to your Customer Success Manager (CSM).
Clarity’s Fundraising Analytics dashboard is designed to help you analyze fundraising activity across various programs, gift types, donor types, and date ranges.
Below, we’ll take a closer look at the views and filters you can use to analyze and customize this dashboard’s data.
Dashboard Tabs and Views
When you open the Fundraising Analytics dashboard, you will see that it has two tabs in the upper left corner of the screen. Whenever you apply a filter to the dashboard on either tab, the filter will remain consistent on both. Below are the views associated with each tab.
Tab One: Fundraising Analytics
There are three views associated with the Fundraising Analytics tab:
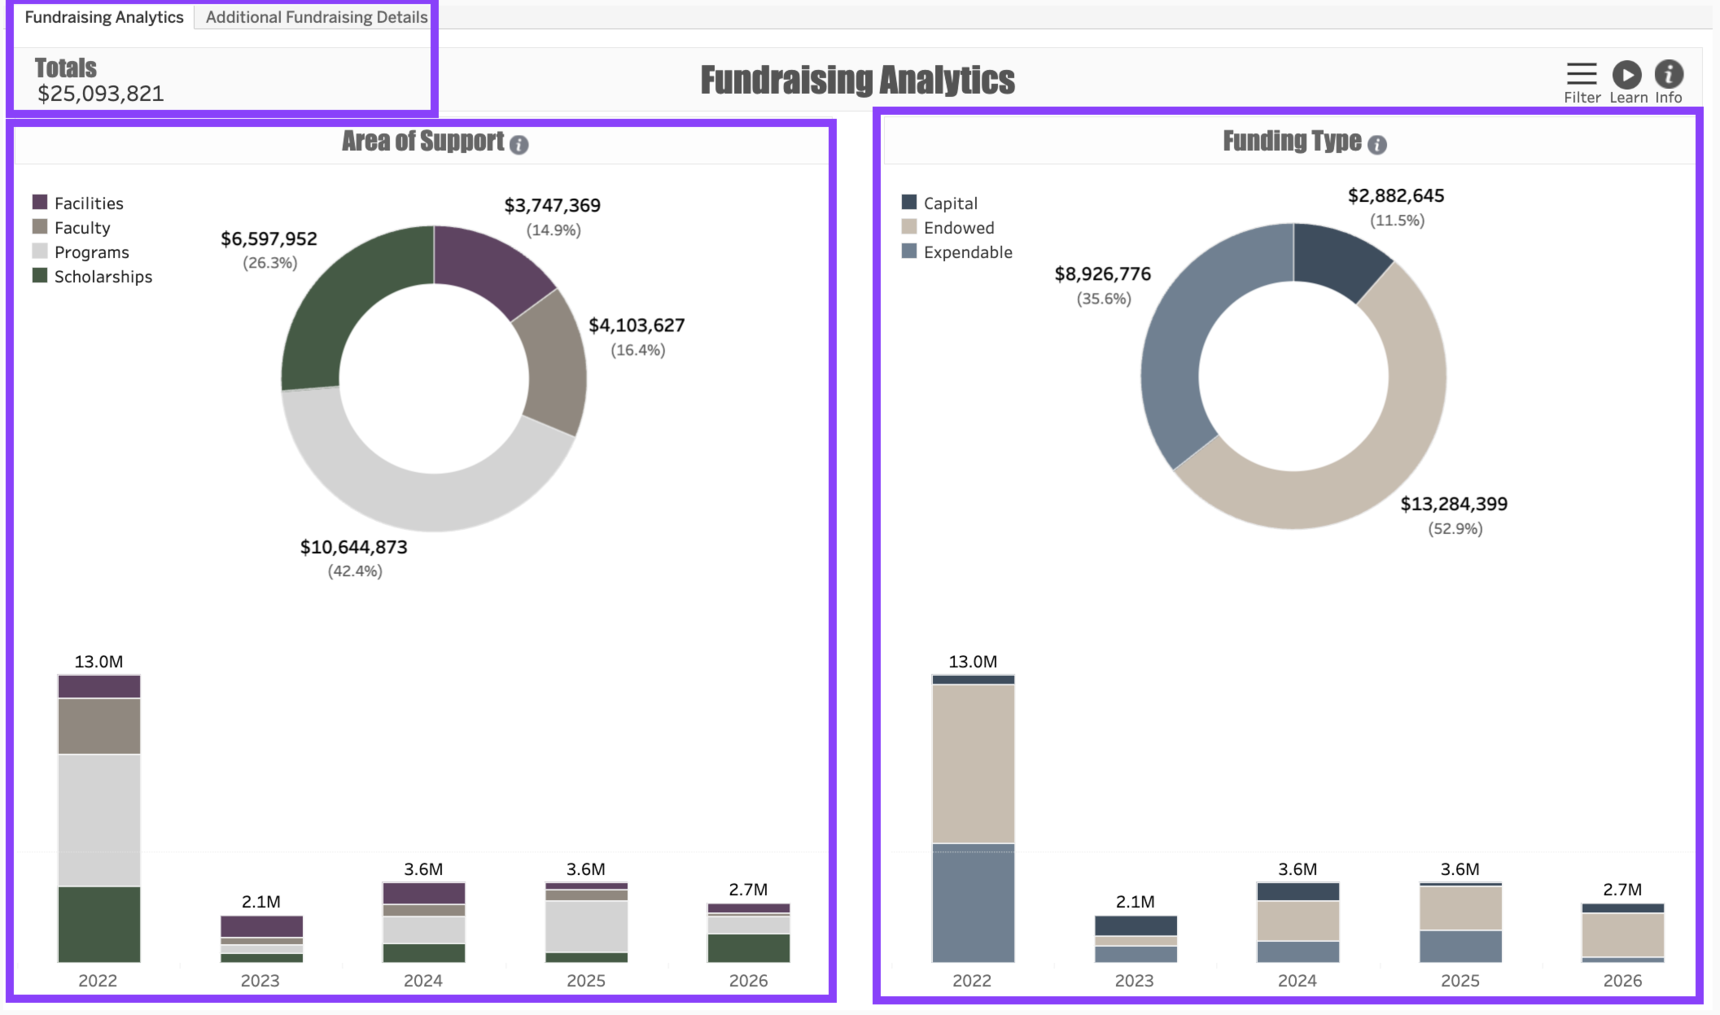
- Totals: The upper left corner of the dashboard includes the total dollar amount associated with the filter applied to the dashboard. For example, if you filter the data to view fundraising over the last five years, the total amount over those five years will appear in this view. Hovering over the view reveals a Cumulative Total graph indicating how the fundraising came in over time.
- Area of Support: This view represents the fundraising results according to four main categories of educational fundraising: Facilities, Faculty, Programs, and Scholarships. Clicking on any one of those categories of support will filter the entire dashboard by that area. Note that for non-education customers, this view will display all fundraising as a single category.
- Funding Type: This view represents the fundraising results according to the three types of funds commonly associated with educational fundraising: Capital, Endowed, and Expendable.
Tab Two: Additional Fundraising Details
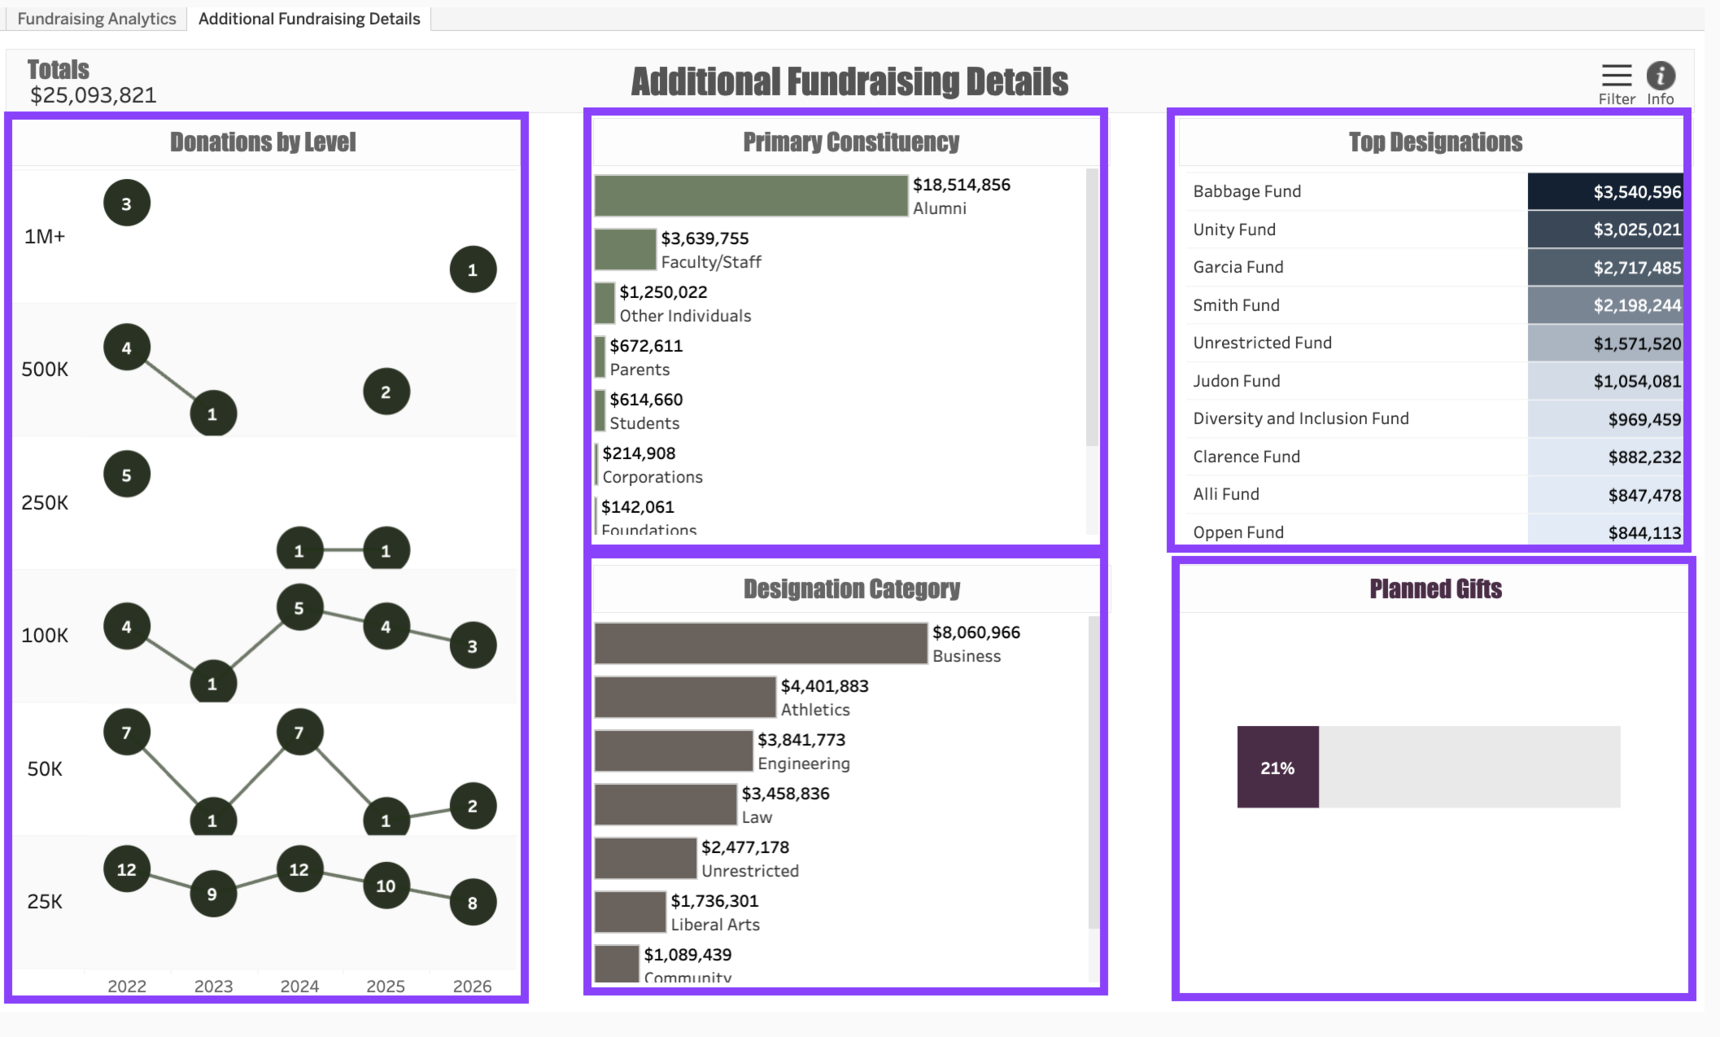
The second dashboard tab contains the Totals view in the upper left corner along with five additional views:
Donations by Level: This view shows the number of donations at each dollar level that were raised each year. Note that each level begins with the minimum amount. For example, the $250K level counts all of the gifts ranging from $250,000 - $499,999.
Primary Constituency: This view shows the total dollars associated with the Primary Constituent Type associated with the Legal Donor who made the gift. For example, if a married couple gives directly through their family foundation, the dollars associated with their gift will appear under the Foundations category.
Designation Category: This view shows the total dollars raised according to the Category associated with the gift transaction.
Top Designations: This view shows a ranked list of fund names representing the funds that received the largest total gift revenue. Note that the view only shows the ten funds that received the most money.
Planned Gifts: This bar represents the percentage of gifts in the dashboard that have a Planned Giving indicator of Yes.
Dashboard Filters
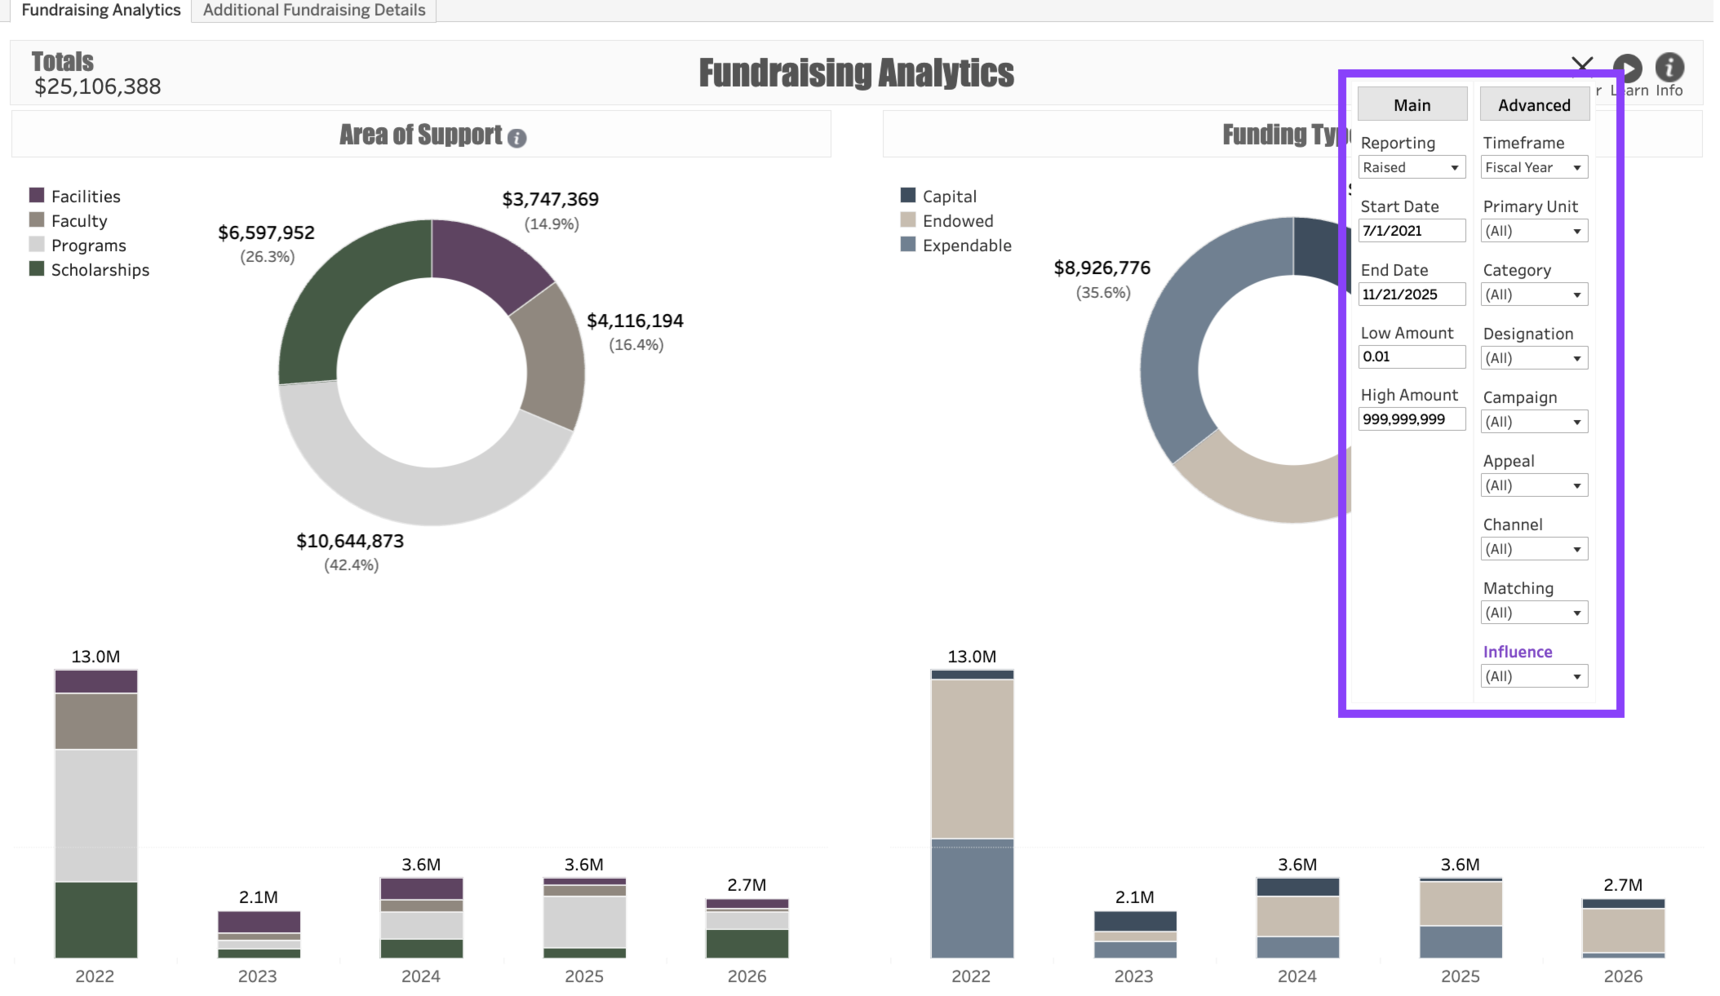
The dashboard uses the same Filters in both Tabs and applies the filtered results consistently throughout. Your filter options include:
Reporting: This drop-down menu allows you to choose between two different reporting categories—Raised or Received. Raised dollars include gifts and pledges, whereas Received dollars includes gifts and pledge payments. To learn more about these reporting standards, see Understanding Raised and Received Reporting.
Start Date: The beginning of the date range in your dashboard.
End Date: The end date for the date range in your dashboard.
Low Amount: Allows you to specify a level below which the dashboard will exclude gift activity. For example, entering “1,000.00” will cause the dashboard to only show activity stemming from gifts of $1,000 or more.
High Amount: The maximum amount of giving the dashboard should include. This defaults to a series of 9s to allow the dashboard to have no upper limit. Replacing this with a number, e.g. 25,000.00, will exclude any gifts that are greater than $25,000.
Timeframe: Choosing Fiscal Year will cause the dashboard to include full fiscal years’ worth of data for each year in the dashboard. Choosing YTD will cause the dashboard to filter each year’s giving so that it only shows fundraising activity as of today’s date for each previous year. For example, if today is October 1, selecting YTD will cause each year’s activity to include gifts beginning on the first day of the fiscal year and ending on October 1 in whatever year is being captured.
Primary Unit: Allows you to filter one or more units associated with the fundraising activity.
Category: If you wish, you can use the Category field to sub-categorize your fundraising units. For example, if your Primary Unit is Athletics, you might be able to filter here to only include gifts to Football-related funds.
Designation: Indicates the specific Fund (or Funds) associated with the fundraising activity. For example, if you only want to see giving related to the Jane Doe Scholarship, selecting it here will filter the entire dashboard so it only includes gifts to that scholarship fund.
Campaign: Allows you to filter the results by the campaign code associated with the gift activity.
Appeal: Allows you to choose one or more fundraising appeals associated with the gift activity.
Channel: Allows you to select one or more fundraising channels, such as Crowdfunding or Text.
Matching: Selecting “Yes” will limit the dashboard to matching gift transactions only. Selecting “No” will show only the gift transactions that are not matching gifts. To include all gifts regardless of whether they are matching, choose “(All)”.
Influence: Customers who use ThankView and/or Pledgemine can use this filter to see the total dollars raised from constituents who received a ThankView or Pledgemine touchpoint prior to making a gift.
Note: Some drop-down menus, such as Designation, include a long list of options to choose from. To make it easier to find the values you are looking for, you can begin to type any string of text in the filter and it will narrow the options down to those designations containing that string.
Use Cases
Your dashboard views are interactive, made up of clickable and hoverable elements that enable thorough data analysis. Together, dashboard views and filters allow for endless experimentation, customization, and creativity.
Below, we offer a few ways you can strategically use the Fundraising Analytics dashboard, but we encourage you to spend time exploring the dashboard in your own time!
Leadership Giving Activity
You're a fundraiser who is responsible for raising gifts between $5,000 and $49,999. Before you set a goal for next year, you would like to see how much money is typically raised each year from gifts in this dollar range.
Gifts from Foundations
You want to see how many gifts have come in this year from Foundations as well as the kind of gifts foundations have made.
Up or Down?
You are responsible for raising money for the Social Justice Fund. You’d like to see whether your efforts are ahead or behind those of prior years.
Checking for Accuracy
You are responsible for fundraising reporting at your institution, and you want to be confident that the fundraising activity reflected in the dashboard matches your internal reporting.
These are just some of the ways you can use the Fundraising Analytics dashboard to better understand your fundraising performance. Let us know how you’re using it!
For any other questions, reach out to EverTrue Support at genius@evertrue.com.
Reply
Content aside
- 8 mths agoLast active
- 33Views
-
1
Following