
Using Your Annual Giving Level Progression Dashboard
The Annual Giving Level Progression dashboard is designed to help you track the giving velocity of annual giving donors.
Dashboard Elements and Views
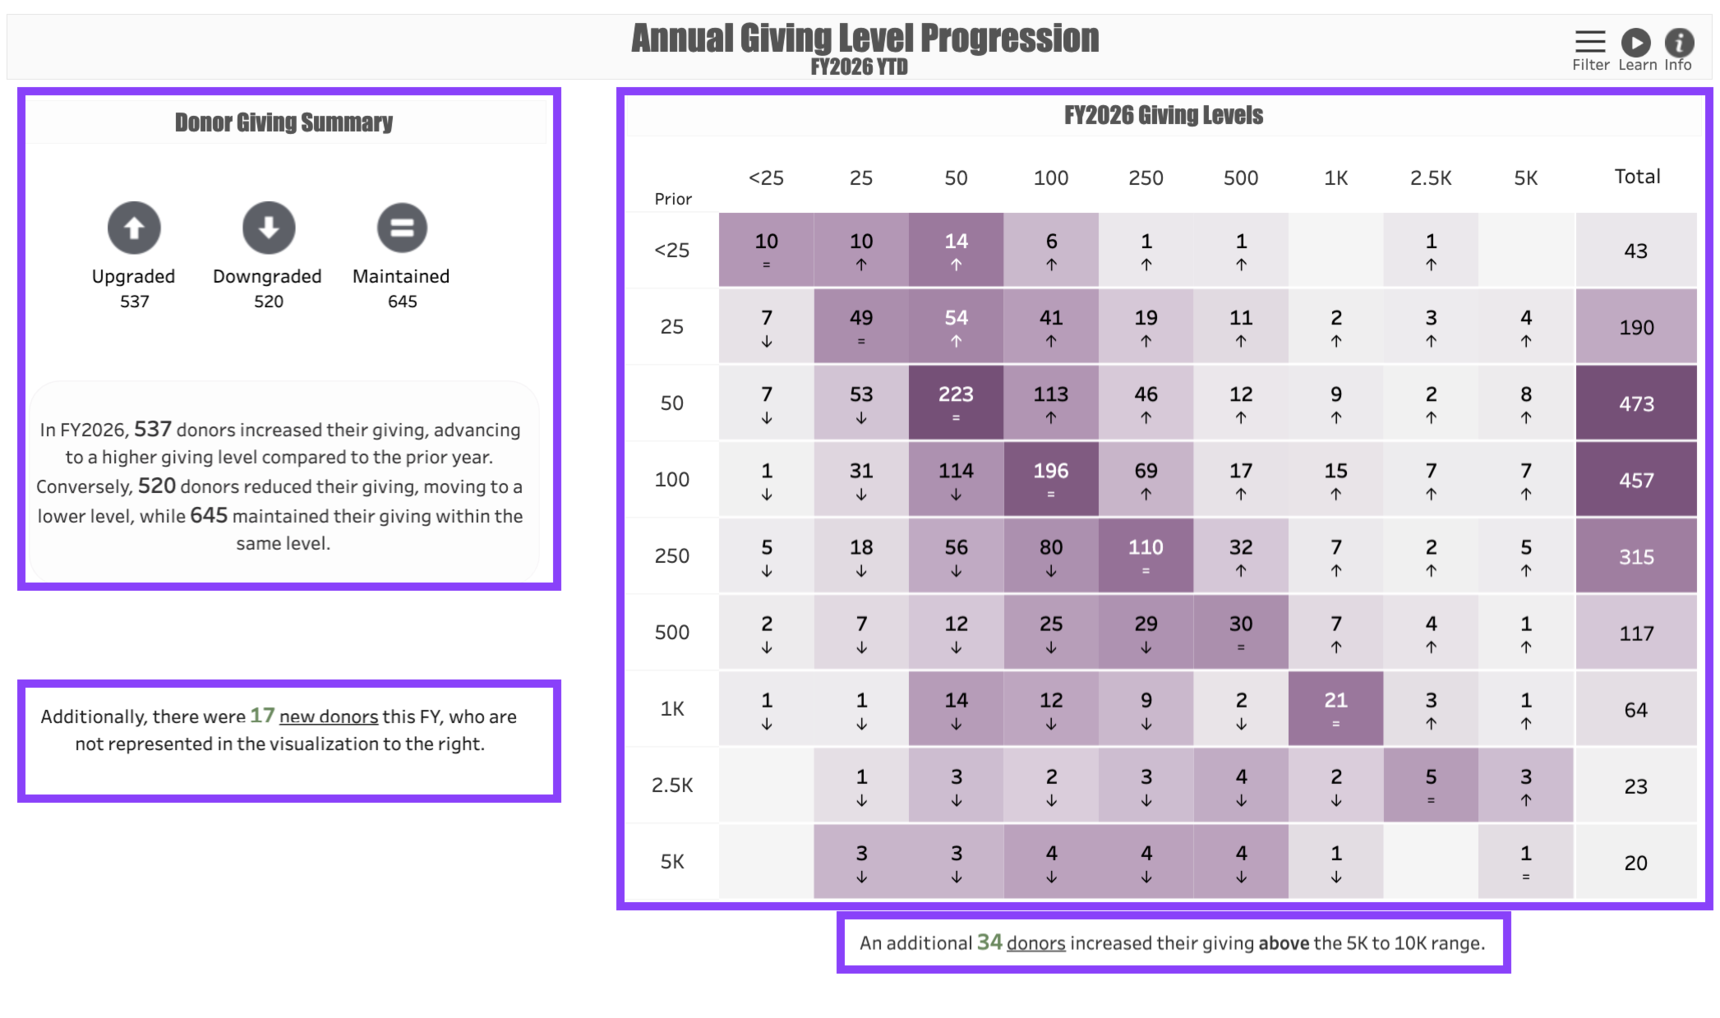
Annual Giving Level Progression has four elements to help you quickly assess the donor migration within the annual giving program.
In the upper left corner of the dashboard is a Donor Giving Summary. This section allows you to quickly see the total number of donors who have Upgraded, Downgraded, or Maintained their giving level since the most recent previous year of giving. Clicking on the icons representing each segment of donors will take you to a List of all the donors in that category, allowing you to perform functions such as downloading the list, clicking into individual Constituent Profiles, or creating a Signal List so they can be included in features like Cadences.
Below the Donor Summary is a link to the records of New Donors who are not represented in the visualization because they have no previous year of giving.
The Giving Level Matrix displays the number of donors whose Current Giving matches the column header along the X axis and whose Prior Giving matches the row header along the Y axis. The Total column to the right totals all donors in the row. Every box within this matrix can be clicked on to reveal the Donor List representing the number of donors in that box.
Below the Giving Level Matrix is a link to donors whose giving has increased to the $5,000 - $10,000 range.
Interpreting the Numbers
The Dollar Totals in this dashboard indicate the donors’ Received Giving, meaning that the dollars include gifts and pledge payments but exclude pledges.
The donor counts include All Donors, regardless of hard or soft credit.
Giving Levels are a total of all gifts in the report timeframe. The dashboard defaults to a Year to Date view, which means that both the Prior Year Giving and Current Year Giving are shown as a total giving amount for the year up to today’s Month and Day.
Each box in the matrix includes the Donor Count represented by that Current Year and Past Year range, and the arrow within the box indicates whether the donors have Upgraded or Downgraded their giving. An equal sign represents donors whose giving level has been Maintained between the current year and the most recent prior year.
All gift amounts should be considered a Total Giving Amount for the year in question. If the report is run on a Year to Date basis, this is the total giving up to today’s month and day.
Dashboard Filters
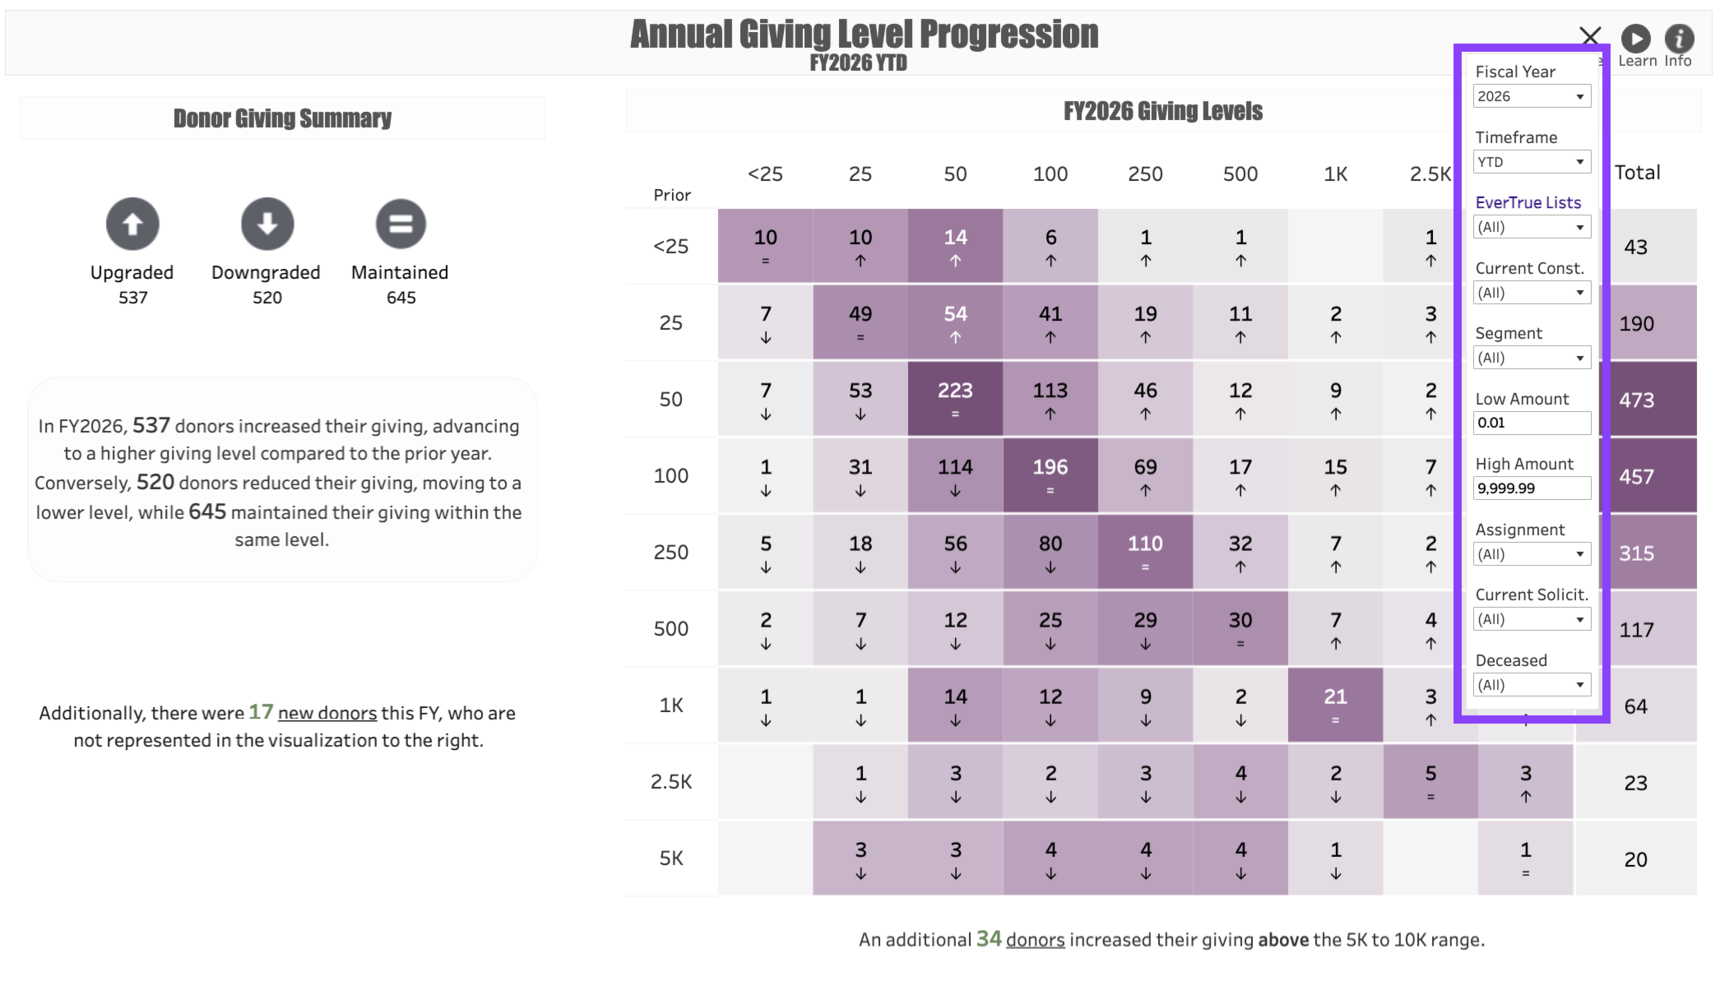
Use the following Filters to customize your dashboard:
Fiscal Year: This represents the fiscal year you would like to measure. Regardless of what year you put in this filter, the Prior Year of giving will indicate whatever year prior to that year that the donor last gave. For example, if you enter 2026 as the fiscal year and a donor’s last gift was made in 2023, their Giving Level would be indicated by the column that matches their total 2026 giving year-to-date and the row that matches their 2023 gift by today’s date in 2023.
Timeframe: This allows you to change the dashboard from a Year-to-Date view to a Full Fiscal Year view. Note that if you do this, the dashboard may skew toward more Downgrades because it will compare the donors’ last full year of giving to this year’s giving to date.
EverTrue Lists: You can use this field to run any Signal List through the dashboard to assess the giving of constituents on the list. Please note that newly-created Lists may take 24 hours to appear in the drop-down filter.
Current Constituent: Allows you to filter the dashboard to donors who make up specific Constituent Types. Note that all constituent types are valid as of Today’s Date, not necessarily the date of the report.
Segment: This filters the dashboard results to donors who are within the specified Annual Giving Segments in the current (or report) year.
Low Amount: The lowest level of gift that will be included in the dashboard.
High Amount: The highest level of gift included in the dashboard. Please note that, regardless of the upper limit you choose, the Giving Level Matrix will only show gifts up to $5,000. That said, the Donor Giving Summary on the left will track all of the gift activity that matches your filter, and you can click on any of the Icons to see the full list of donors.
Assignment: Use this filter if you want to limit the dashboard to only include either Assigned or Unassigned prospects.
Current Solicitor: This filter allows you to include or exclude constituents who are assigned to specific fundraisers.
Deceased: Use this filter to remove Deceased donors from the dashboard. This is a good idea if you plan to perform Outreach on individuals in the list, but please note that it may also make your dashboard results less accurate.
Use Cases
Your dashboard views are interactive, made up of clickable and hoverable elements that enable thorough data analysis. Together, dashboard views and filters allow for endless experimentation, customization, and creativity.
Below, we offer a few ways you can strategically use the Annual Giving Level Progression dashboard, but we encourage you to spend time exploring the dashboard in your own time!
Dramatic Giving Increases
You are a prospect researcher and you would like to explore the records of donors who recently increased their giving dramatically.
Downgrade Call List
You would like to review the donors assigned to you whose giving has downgraded this year to see if you can approach them about increasing their support.
New Donor Stewardship
You would like to steward the new donors who gave for the first time this year.
These are just some of the ways you can use the Annual Giving Level Progression dashboard to better understand your fundraising performance. Let us know how you’re using it!
For any other questions, reach out to EverTrue Support at genius@evertrue.com.
Reply
Content aside
- 8 mths agoLast active
- 16Views
-
1
Following