
Using Your Signal Influence Dollars Dashboard
Note: The Signal Influence Dollars dashboard is a feature of Signal by EverTrue. If you have questions about Signal, please reach out to your Customer Success Manager (CSM).
Clarity’s Signal Influence Dollars dashboard uses imported gift transaction data, alongside Signal Cadences and Collaborative Tasks data, to capture all giving influenced by Signal outreach within a user-defined timeframe. This dashboard provides your fundraising team with a high-level summary of total dollars raised or received, donations made, and average gift amounts, as well as detailed breakdowns by solicitor and week.
By connecting donor touchpoints to influenced dollars, this dashboard empowers your team to track progress, visualize the impact of outreach efforts, and refine fundraising strategies to drive future giving!
Below, we’ll take a closer look at the views and filters you can use to analyze and customize this dashboard’s data. Then, we’ll focus on an example of how to use the dashboard to track giving for a specific segment of donors. Let’s get started!
Dashboard Views
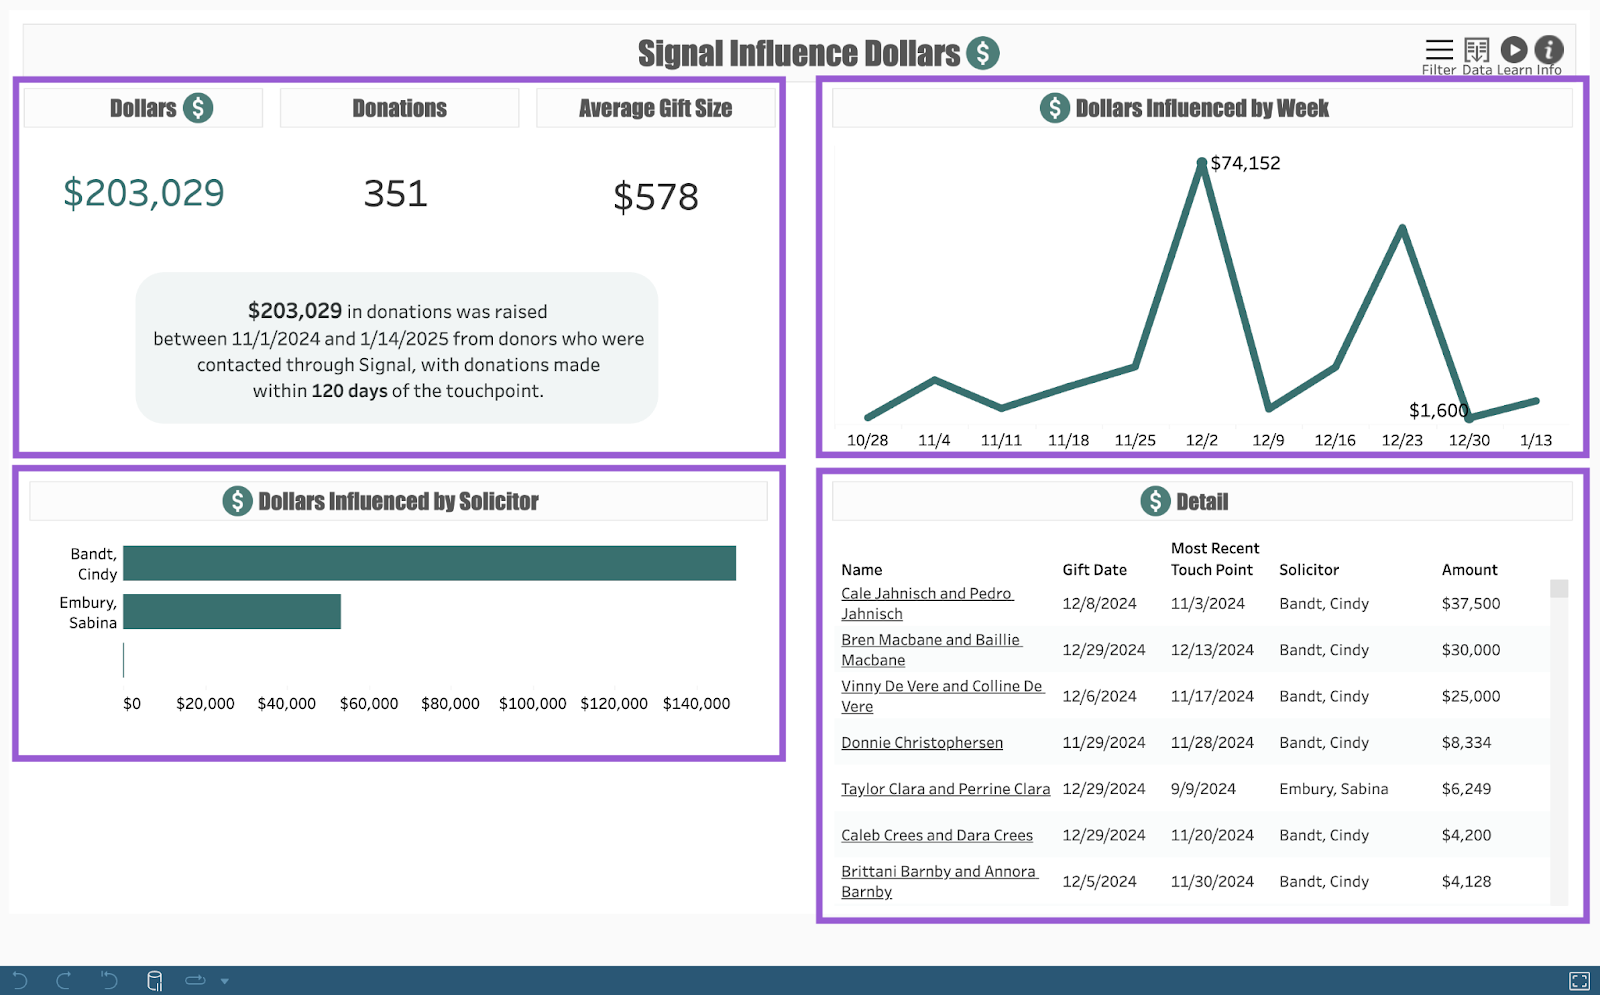
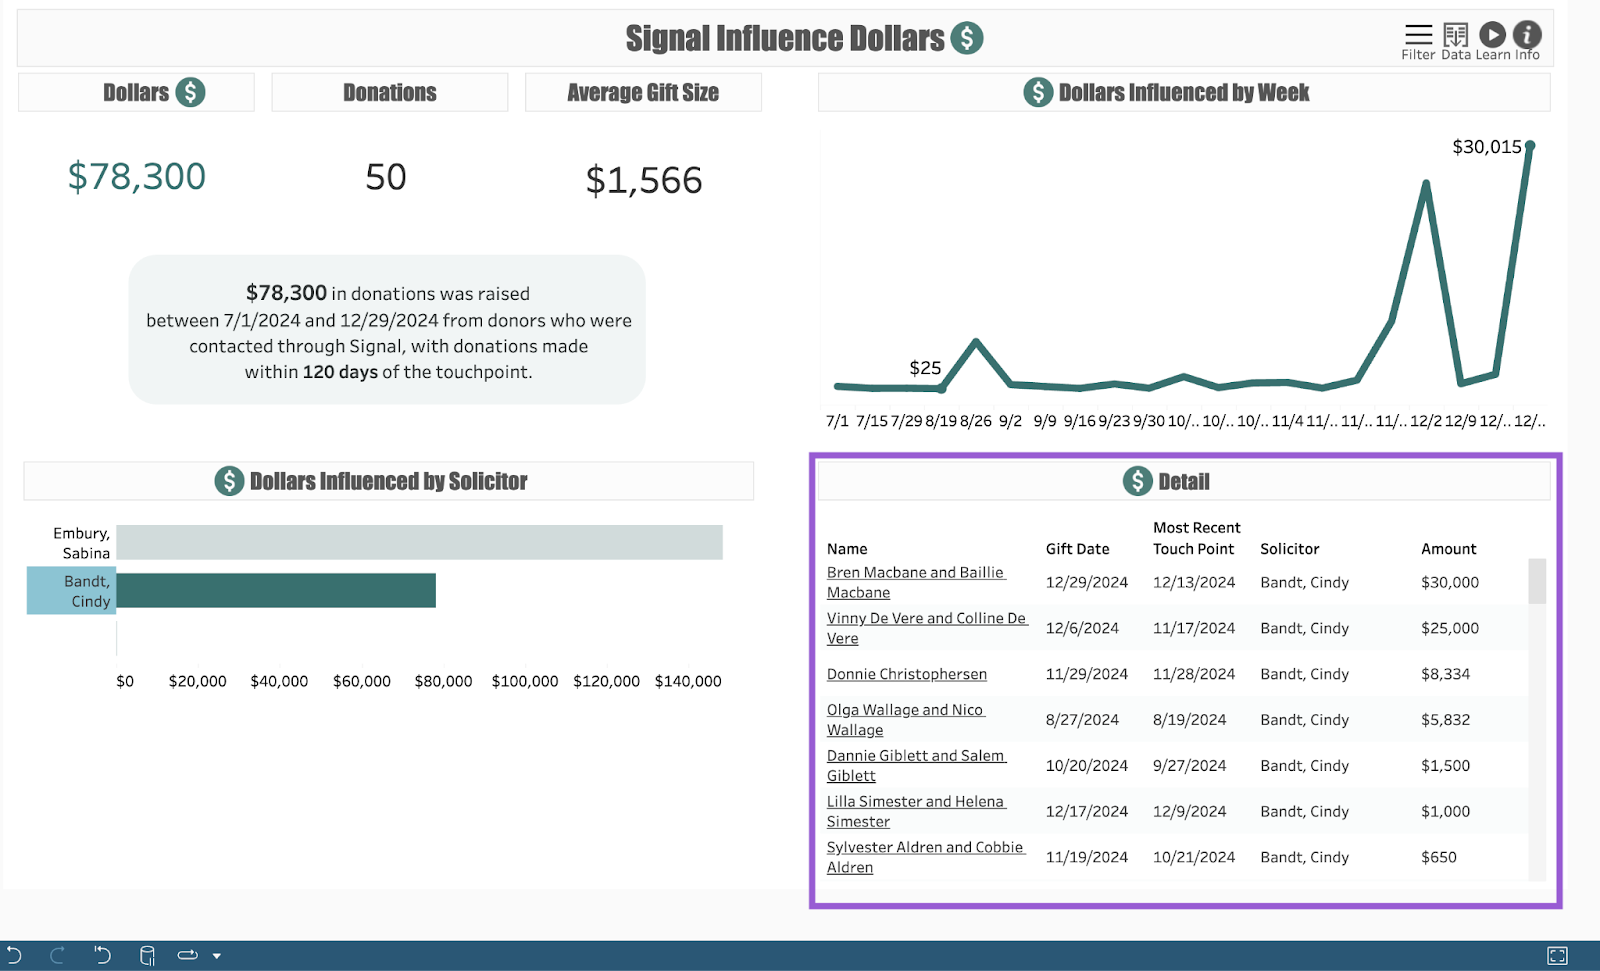
When you open the Signal Influence Dollars dashboard, you’ll see four main views:
- Dollars, Donations, Average Gift Size: Tracks total dollars raised or received, the number of donations made, and average gift amounts from donors contacted through Signal.
- Dollars Influenced by Solicitor: Displays total dollars and number of gifts attributed to individual fundraisers, ranked from highest to lowest total dollar amount.
- Dollars Influenced by Week: Visualizes week-to-week giving totals in an interactive line graph.
- Detail: Provides detailed gift-level information, including donor names, gift dates, most recent touchpoint dates, attributed solicitor names, and gift amounts. This view is sorted by highest to lowest dollar amount.
Dashboard Filters
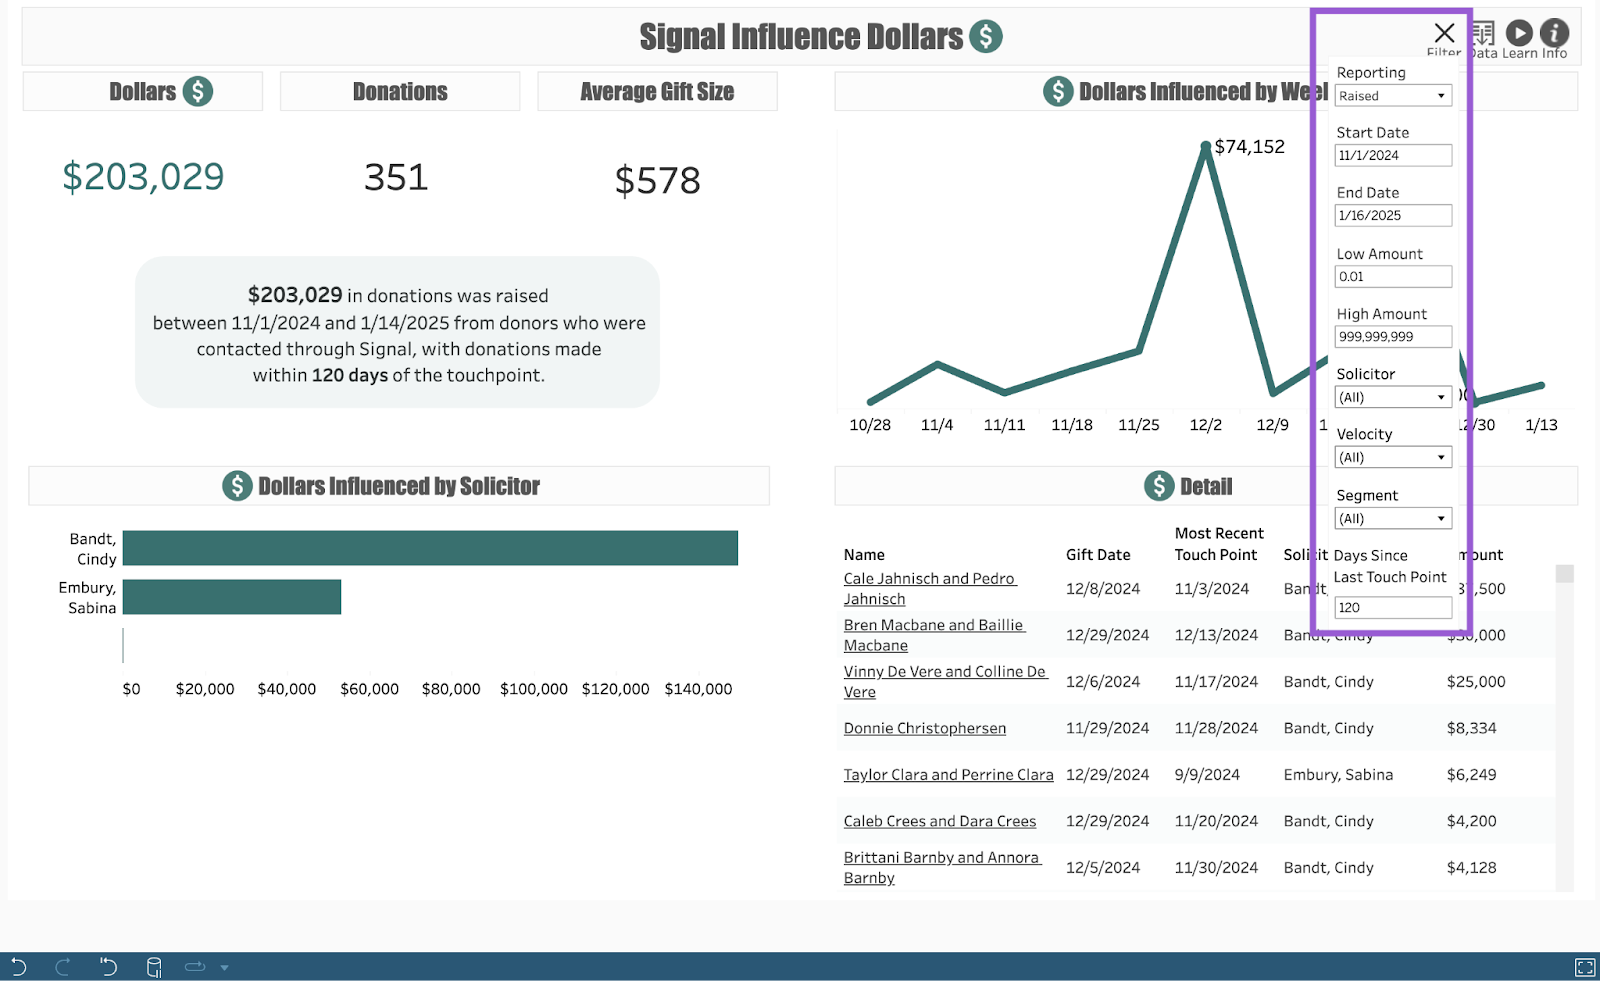
Customize your dashboard’s data with the following filters:
- Reporting: Filter to giving categorized as either “Raised” or “Received.” This filter defaults to “Raised.”
- Start Date: Filter to giving that occurred on or after the selected date. By default, this is set to the first date of the current month minus two months (e.g., if today is 1/17/25, Start Date defaults to 11/1/24).
- End Date: Filter to giving that occurred on or before the selected date. By default, this is set to the day before the current date (e.g., if today is 1/17/25, End Date defaults to 1/16/25).
- Low Amount: Filter to giving that is equal to or greater than the specified amount.
- High Amount: Filter to giving that is equal to or less than the specified amount.
- Solicitor: Filter to giving attributed to the selected solicitor name(s).
- Velocity: Filter to giving based on donor behavior patterns, (e.g., “Upgraded,” “Downgraded”).
- Segment: Filter to giving based on donor categories (e.g., “Acquisition,” “Lapsed Last FY,” “Retention, Reactivated”).
- Days Since Last Touch Point: Filter to giving that occurred within a specified number of days after the donor’s last engagement (e.g., a gift was made within 60 days of their most recent touchpoint). This filter defaults to 120 days.
Use Case: Tracking Influenced Donor Segments
Your dashboard views are interactive, made up of clickable and hoverable elements that enable thorough data analysis. Together, dashboard views and filters allow for endless experimentation, customization, and creativity.
Below, we will focus on one way you can strategically use the Signal Influence Dollars dashboard, but we encourage you to spend time playing around with the dashboard in your own time!
Use case: How can I track lapsed donors who gave after Signal outreach in the first half of the fiscal year, and then find additional donor details in Signal?
Step 1. Apply Your Filters
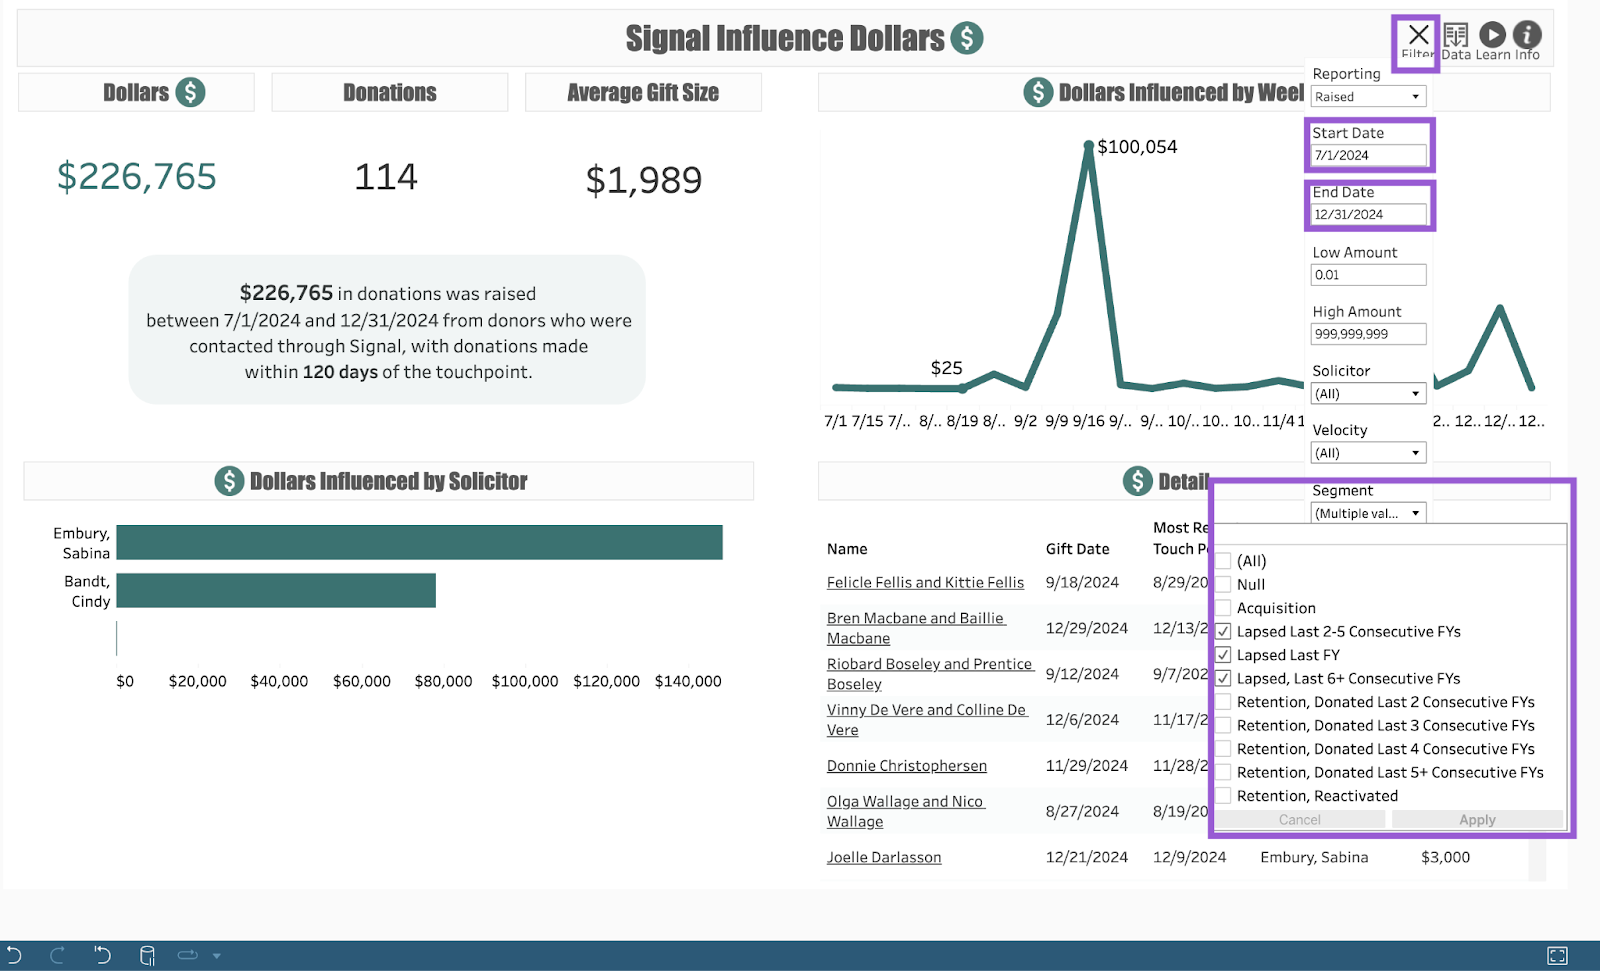
Start by clicking the Filter button in the top-right corner. You can adjust as many filters as you’d like!
For this example, we will change the Start Date and End Date filters to narrow down giving to the first half of the fiscal year. Select each filter’s date field and either manually type or use the calendar to choose a new date. Then, use the Segment filter to select all lapsed categories and click Apply. The dashboard will dynamically update to match your selection. Click Filter once more to close the dashboard’s filters.
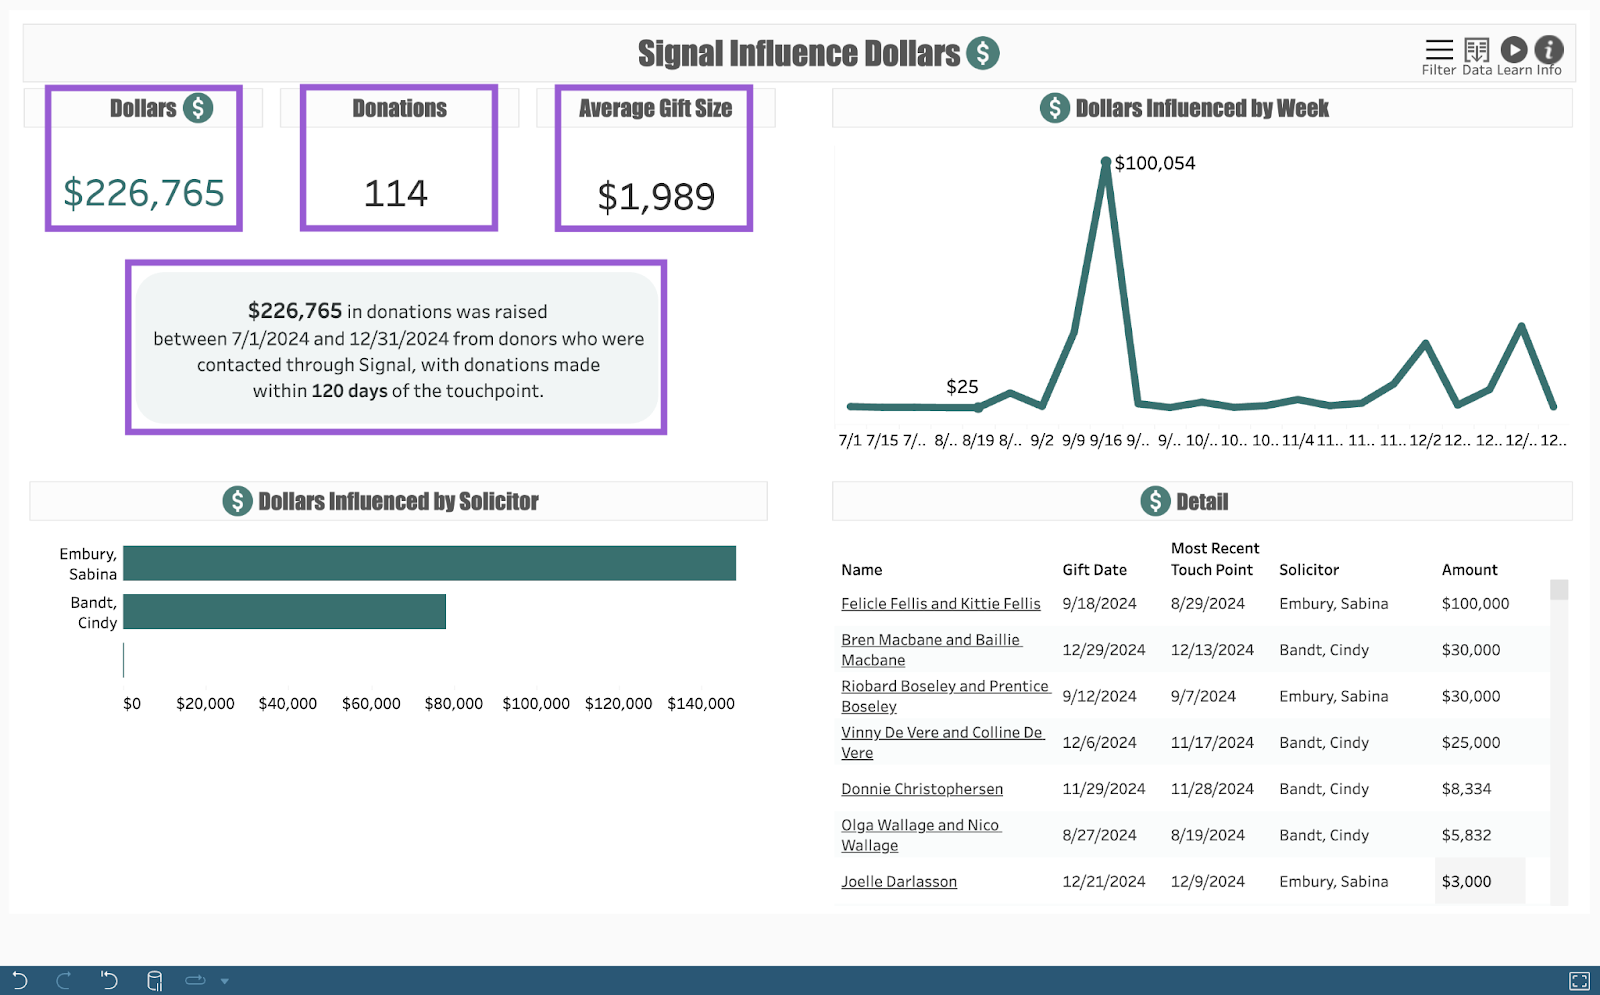
Step 2. Review Dollars, Donations, and Average Gift Size
Look at the dashboard’s Dollars, Donations, Average Gift Size view to review the total dollars raised, number of donations, and average gift size for lapsed donors during this time period. A callout beneath these metrics offers a detailed summary of influenced giving.
Step 3. Track Weekly Giving Totals
Shift your focus to the Dollars Influenced by Week view to see a line graph tracking week-to-week Signal-influenced giving totals. Look for spikes in activity that may align with outreach campaigns, and hover over data points to see specific week details.
Step 4. Select a Solicitor Name
In the Dollars Influenced by Solicitor view, hover over the bar charts to see the dollars and gift count attributed to each fundraiser. Click on an individual name to filter the entire dashboard and focus on only their activity during the selected timeframe.
Step 5. Review Giving Details
In the Detail view, analyze gift-level information for the selected fundraiser. This includes constituent name(s), gift dates, most recent touchpoint dates, and gift amounts.
Step 6. View a Donor in Signal
To learn more about a specific donor or find additional information about their gift, click the donor’s name in the Detail view to navigate to their corresponding constituent profile in Signal. Here, you can research the constituent and their giving history, add them to a cadence or a list, and more!
That’s just one way you can use your Signal Influence Dollars dashboard to track giving! Let us know how you’re using it!
For any other questions, reach out to EverTrue Support at genius@evertrue.com.
Reply
Content aside
- 1 yr agoLast active
- 88Views
-
1
Following