
Navigating Your Clarity Dashboards
Note: Clarity is a feature of Signal by EverTrue. If you have questions about Signal, please reach out to your Customer Success Manager (CSM).
Let’s explore the features you’ll find in your Clarity dashboards, accessible via the Clarity tab on your left-hand navigation bar! Below, we’ll use the Signal Top Prospects dashboard to review the functionalities that are consistent across most of your dashboards.

Reviewing Your Dashboard Layout
Step 1. Review Your Dashboard User Notes
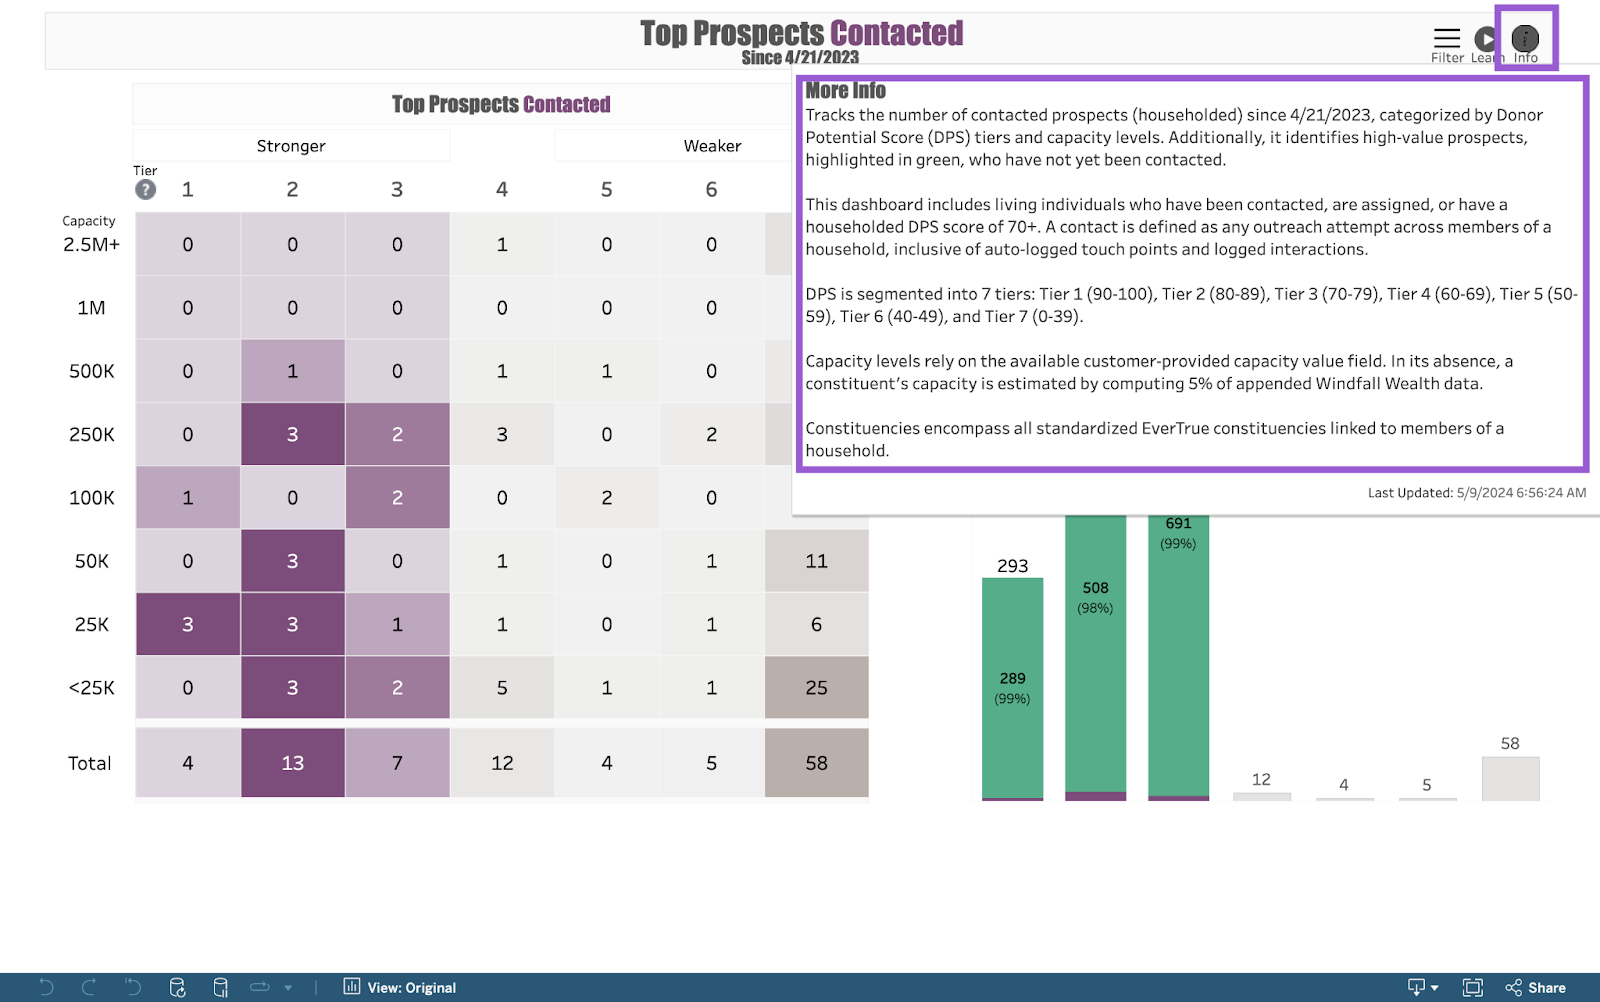
Every Clarity dashboard includes helpful user notes to ensure easy understanding of the data being tracked. At the top-right of each dashboard, you’ll find an Info icon. Hover over this icon to reveal these notes!
Step 2. Review Your Dashboard Video Story
To the left of the user notes, you’ll find a Learn button. Clicking this reveals a video story that serves as a visual training accompaniment, guiding you through some of the dashboard’s features and suggesting ways to use the data to your advantage. We highly recommend referencing these videos when using your dashboards to ensure you can maximize their potential!
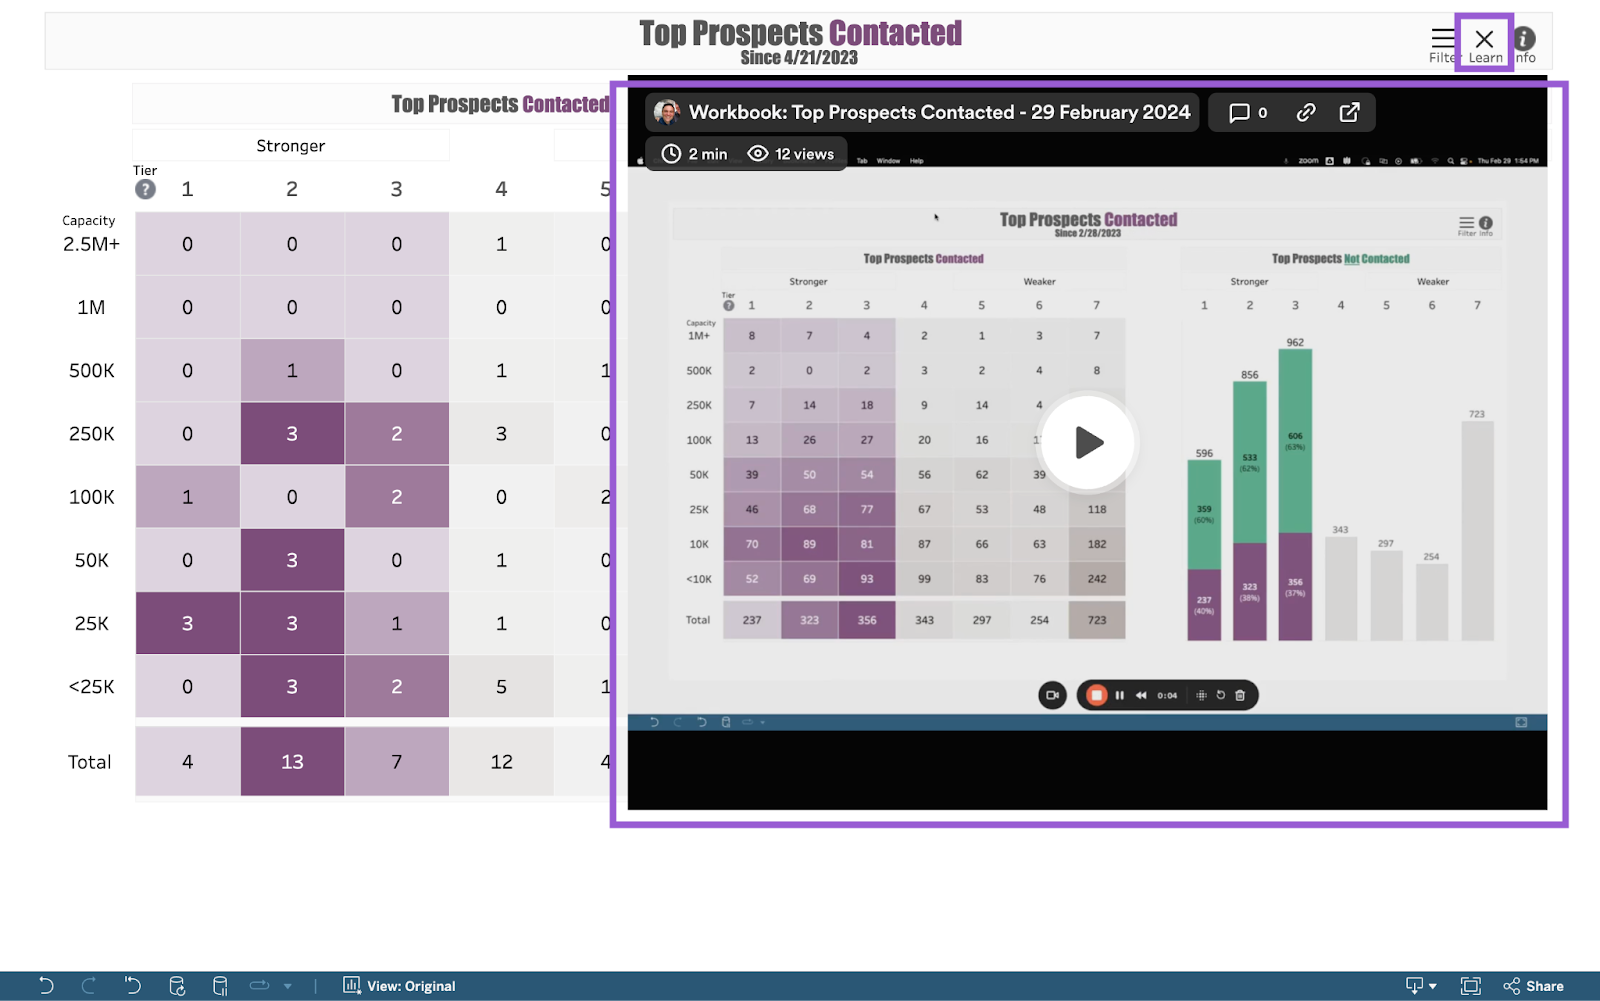
Note: Some dashboards do not include a video story, but for most, this additional learning resource is available!
Step 3. Review Your Dashboard Filters
Every Clarity dashboard includes a tailored set of filters that can be used to customize the displayed data. At the top-right of each dashboard, you’ll find a Filter button. Click on it to reveal the filters specific to that dashboard!

Step 4. Review Your Dashboard Views
The majority of your dashboard’s layout is dedicated to dynamic views containing various data. Most dashboards contain multiple views, enabling you to review and compare different types of data simultaneously. These views are interactive, with clickable and hoverable elements that allow for thorough data analysis. Watch below to see how you can interact with a dashboard, and how applying filters can further tailor the visible data!
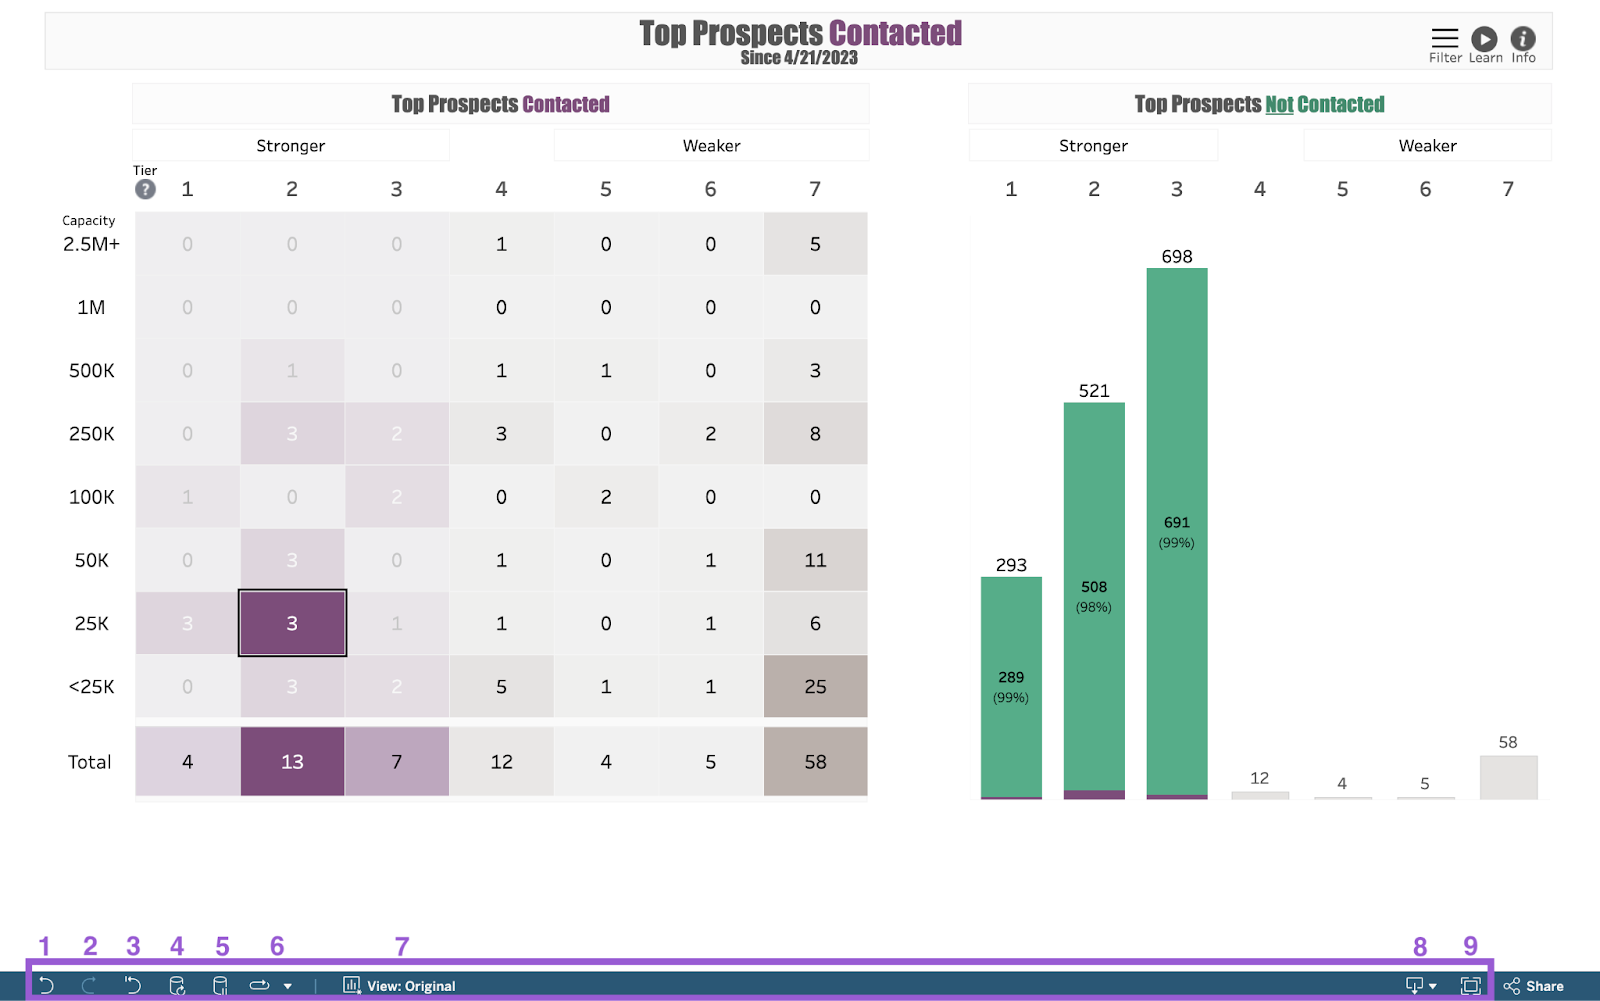
Step 5. Review Your Dashboard Toolbar
At the bottom of your dashboards, you’ll find a toolbar consisting of a series of buttons that enable you to take different actions. These buttons include:
- Undo: Click to reverse your last dashboard action.
- Redo: Click to redo the last action you reversed with the Undo button.
- Reset: Click to return to your dashboard’s starting view. This button comes in handy when you’ve clicked into several widget components and want to start fresh!
- Refresh: Click to update the data in your current dashboard view. This button is useful if the dashboard’s data source has updated during your use.
- Pause: Click to pause data queries while using your dashboard. Click again to resume data queries.
- Replay: Click to replay the dashboard’s animation seen when interacting with the dashboard widgets or applying filters. Animation can be replayed at ½ speed, actual speed, or 2x speed.
- View: Click to save custom dashboard views or apply previously-customized dashboard views. We’ll cover this button in more depth later in this article!
- Download: Click to download your current dashboard view in various formats. We’ll cover this button in more depth later in this article!
- Full Screen: Click to view your dashboard in full screen.
Note: Though a Share button is visible at the far-right of your dashboard toolbars, its capabilities cannot be used due to dashboard views being set to private.
Taking a Closer Look at Your Dashboard Toolbar
Step 1. Save Custom Dashboard Views
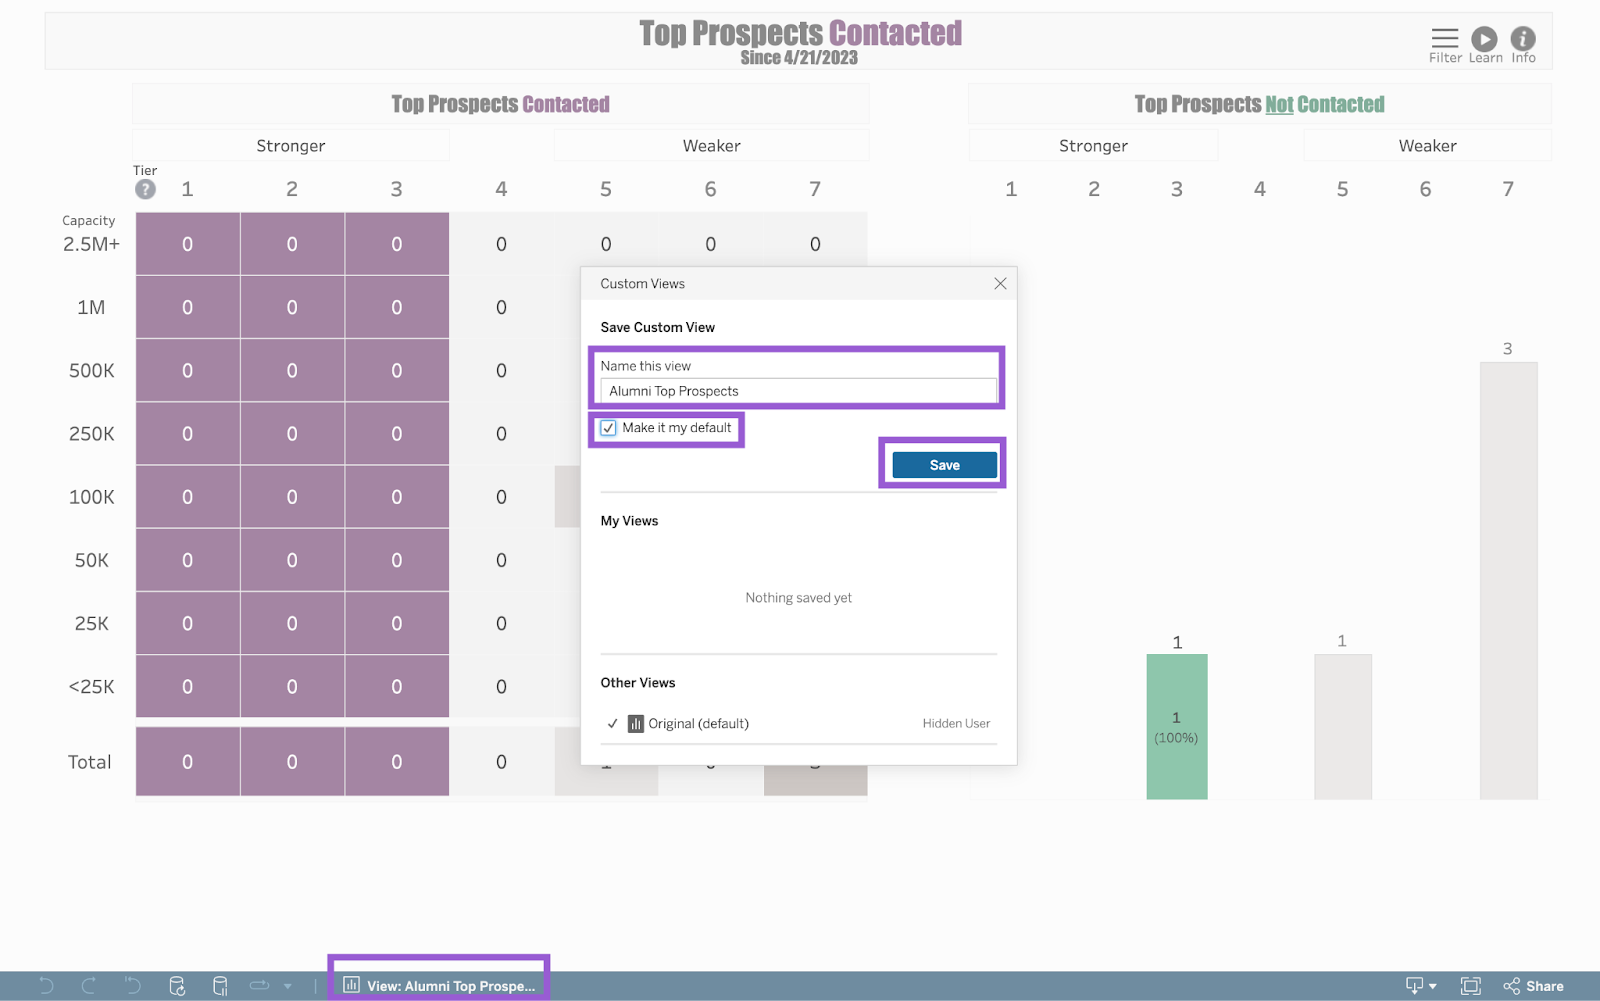
Every Clarity dashboard comes with the ability to save customized data views, making it easy to quickly access tailored data without needing to reapply filters. After filtering a dashboard to fit your specific needs, click the View button found near the left of your toolbar. A Custom Views popup will appear in which you can name the view under Save Custom View. If you’d like to set the filtered view as your default, ensuring it auto-populates every time you open the dashboard, check the box next to Make it my default before clicking Save to finish adding.
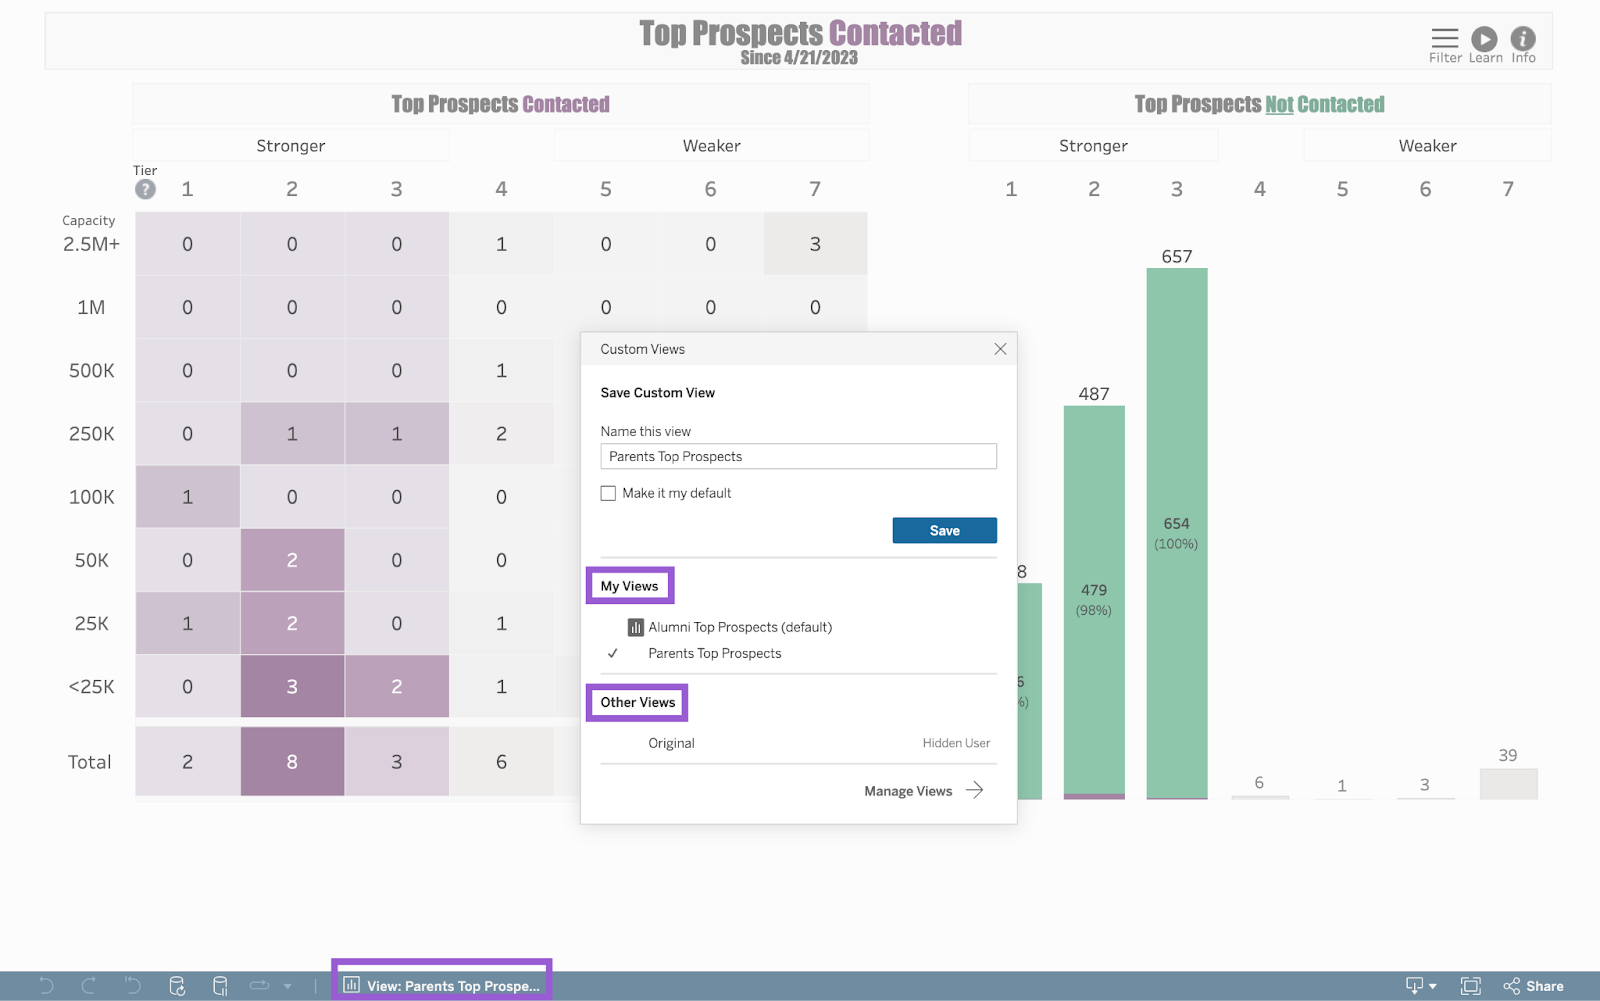
You can save as many views as you’d like (keep in mind, only one view can be set as your default)! Click View to easily swap between any of your customizations, found under My Views. You can also access the dashboard’s original, unfiltered view, found under Other Views.
If you need to make changes to your view, click Manage Views at the bottom of your Custom Views popup. Use the pencil icon to edit the view’s name, or the trashcan icon to delete the saved view. The eye icon indicates that the view is private and only visible to you. This cannot be changed.
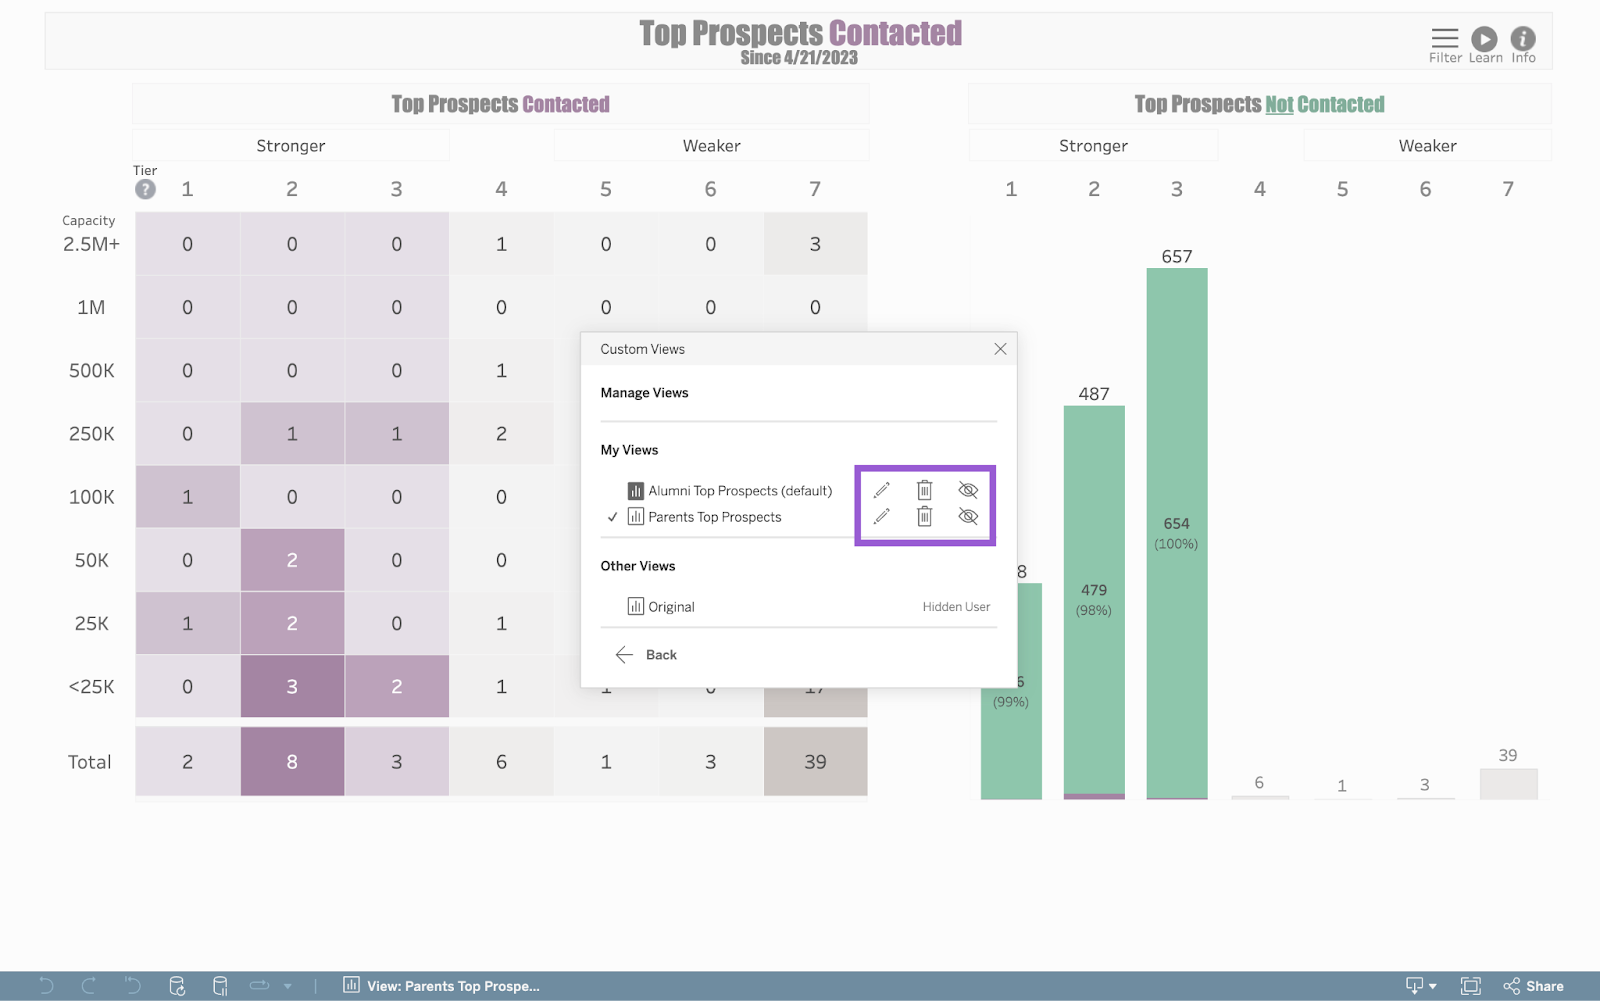
To modify the data applied to an open view, adjust the dashboard’s filters as needed, click View, and click the Save button once more to set the adjustments.
Step 2. Download Your Dashboard Data
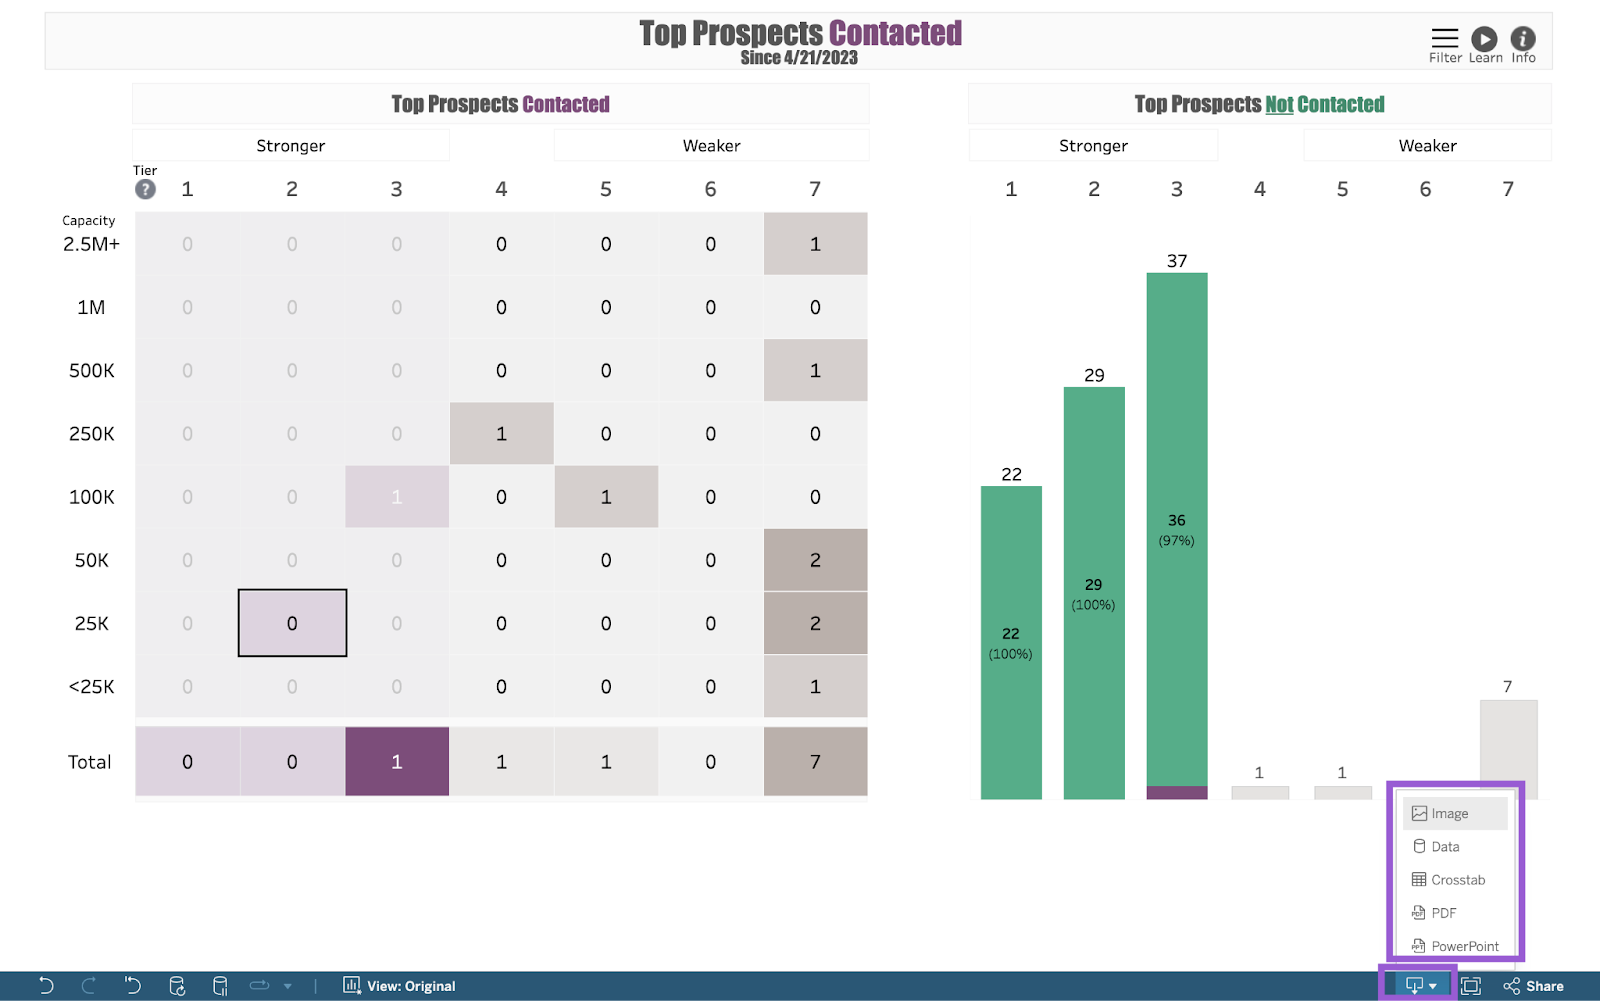
After filtering a dashboard’s data to fit your specifications, you can download the results in different formats for use in other external tools, such as Microsoft Excel. Click the download button found at the far-right of your toolbar, and select your preferred format. Format options include:
- Image: Downloads the dashboard’s data as a PNG file.
- Data: Choosing this option will prompt a new browser window to appear. This browser contains a Summary tab that displays aggregated data from the fields shown in your current dashboard view. Use the browser’s Show Fields dropdown to customize which fields you’d like to include in your download. When you’re ready, click the Download button to download the data as a CSV file.
- Crosstab: Choosing this option will prompt a Download Crosstab popup to appear. This popup contains different sheets from the dashboard that you can select and download in an Excel or CSV format. When you’re ready, click the Download button to download the data.
- PDF: Choosing this option will prompt a Download PDF popup to appear. This popup contains different dropdowns that allow you to specify the data, scaling, page size, and orientation you want to include in your download. When you’re ready, click the Download button to download the data as a PDF.
- PowerPoint: Choosing this option will prompt a Download PowerPoint popup to appear. This popup contains a dropdown that allows you to specify the data you want to include in your download. When you’re ready, click the Download button to download the data as a PDF.
For any other questions, reach out to EverTrue Support at genius@evertrue.com.
Reply
Content aside
- 2 yrs agoLast active
- 483Views
-
1
Following