
Clarity Data Validation Guide
This guide will support you through the process of validating your Clarity data so that it matches your internal reporting.
Your Data Validation Team
Your implementation partner will ask you to nominate the colleagues who should participate in the data validation process. These are the roles that we recommend you include:
A giving data expert: whoever is most familiar with your giving data should be in this role. Often, this is the same person who has been leading the implementation up until now. It should be someone familiar with the standard report criteria included in your giving reports.
An annual giving expert: we recommend that this be the person responsible for leading your annual giving function. It should be a person who is very familiar with how annual giving data is used.
A prospect management expert: this should be the person in charge of your prospect data management policies and practices.
Please let your implementation partner know the names of the people you would like to include in data validation.
Getting Started
Before we begin, it is a good idea to familiarize yourself with three resources included at the top of Clarity dashboards: Filter, Learn, and Info. These resources are always located at the upper right corner of your dashboard.
- Filter allows you to change the reporting criteria of the dashboard, including both the visualization and the underlying data it includes.
- Learn reveals a brief (~ 5 min.) video “tour” of the dashboard and how you can use it.
- Info contains details on how the dashboard is pulling the data (e.g., whether constituents are shown as separate individuals or as households, etc.).
Whenever you begin working to validate a dashboard, we recommend that you watch the video and explore “Info” and “Filter” so that you can understand the purpose of the dashboard and its various elements. When your dashboards are up and running, you and your Clarity-using colleagues will continue to have access to these resources every time you open a dashboard.
Part 1: Understanding Data Validation and Mapping
What do we mean when we say “validating Clarity data”? Specifically, we want to be certain that the reporting in Clarity achieves the same results that you would expect from running a custom report at your institution. Before your dashboards are validated, it is normal for your results to be different from your custom-built reports. For example, you might have a report that includes a “number of donors” figure that is different from Clarity’s “number of donors” over the same time period. This could be for three reasons:
Your reporting might be configured to count things differently than Clarity does. For example, you may have an internal report that only counts legal donors as “donors,” whereas Clarity might count legal and soft-credited donors. If and when situations like this occur, we will ask you to compare the data from your CRM using the same criteria that Clarity does (e.g., including hard and soft donors) and check again to see if the numbers align. When you pull numbers from your CRM using Clarity criteria, you should arrive at the same numbers as Clarity dashboards return. If not, your implementation partner will work with you until the numbers align.
The second reason your reporting might not match Clarity is that your data mapping needs to be adjusted. For example, you may have a constituent type called “Attendee” that your institution includes in all alumni donor reporting. However, we may currently be mapping your “Attendee” constituents to the alternative Clarity category called “Other Individuals.” If this example were true, running a report on the number of alumni donors would exclude “Attendee” records, which would run contrary to your internal practices. Situations like this can be resolved by letting your implementation partner know that you want to re-map the “Attendee” constituents to the “Alumni” category.
If both of the above scenarios have been ruled out, the only other possibility is that your data sync does not include all of the information included in your CRM. For example, you may have excluded the records of deceased people from your EverTrue data sync. This will render the dashboards inaccurate because, regardless of whether a person is living today, their prior giving history is part of your giving totals. Your implementation partner can assist you with making sure all of your data is included in your sync.
Whenever you see dashboard results that don’t “look right,” we recommend that you start by checking the way your data is being mapped. You can do this by running the Clarity report called Data Standardization. As you can see in the image below, this dashboard shows each value in your CRM and compares it to how EverTrue has categorized your data in Clarity.
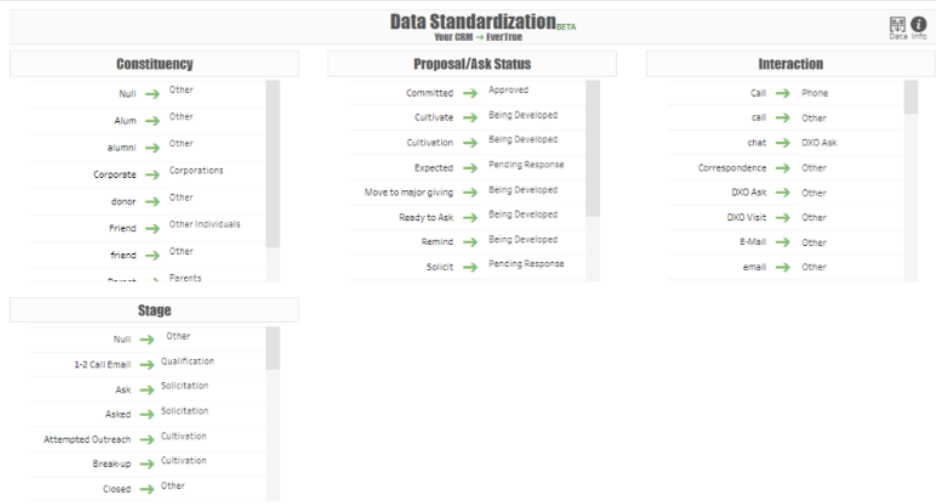
Please note: Clarity consolidates your data into specific categories that apply to all customer data, so we don’t add to the categories you see listed. However, we hope and expect that each category will contain a value that works best for the data you’re mapping. Remember that every time a data element is used in a dashboard, it will be mapped consistently to the same specific category. So, in the example above, you cannot count “Attendees” as “Alumni” in one dashboard and “Other Individuals” in another.
When reviewing the mapping in Clarity, note that the “Info” button in the upper right corner of the dashboard gives you more information on all of the Clarity categories. Simply move your cursor over the “Info” icon to see all of your options.
Part 2: Validating Giving Dashboards
Before involving the rest of the data validation team, we recommend that the giving data expert has validated the accuracy of Clarity’s giving data. This will save time when you validate the other dashboards in the suite, because you won’t need to check your giving results each time.
Fundraising Analytics
Fundraising Analytics is the foundational giving report in Clarity, so we recommend you validate the giving data with this dashboard. If Fundraising Analytics is not returning correct results, you will not have accurate results in any of the other giving reports. Conversely, once Fundraising Analytics is returning accurate results, you are well on your way to validating all of the giving dashboards in Clarity.
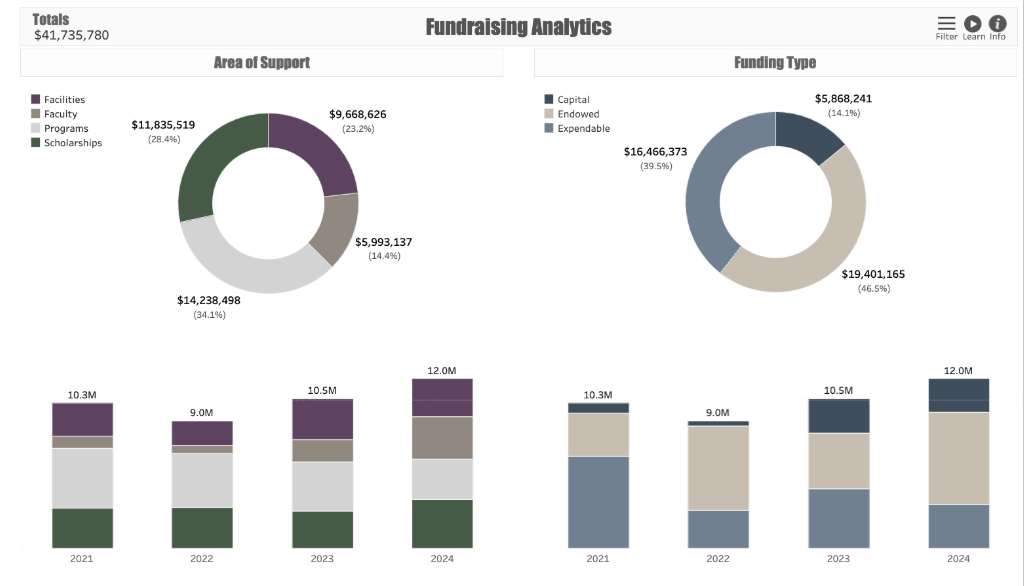
Open the dashboard filter and narrow your results to a specific previous (completed) fiscal year by entering the first and last date of that year.
Using the same filter, make sure the Reporting filter is set to “Raised.”
Compare the total dollar amount raised (under “Totals” in the upper left corner) to the dollar amount your institution raised in that year. To pull the data in your CRM, be sure to include the legal dollar amount and to exclude pledge payments. (See “Info” in the upper right corner for the full description of “raised” fundraising criteria.)
Now move your cursor over the “Totals” section in the upper left. Note the number of donors and donations, which appear in the pop-out window. Do the counts of donors and donations match the numbers from your CRM for that year?
If these amounts match, use the filter to change the Reporting option to “Received” and compare that to the amount of cash your institution received in that year. (Again, the “Info” section includes criteria for what counts as “received.”)
Again, refer to the “Totals” section in the upper left, and confirm that the dollars, donor count, and donation count match the numbers in your CRM for received giving.
If there are discrepancies between your CRM totals and the totals in Fundraising Analytics, the most likely cause is that your data import file (“Giving”) may not include all of the gifts captured in your CRM. For example, it may not include deceased donors, organization donors, planned gifts, etc. To address the discrepancies, please stop the validation process and contact your implementation partner at EverTrue so we can expand the data you share.z
Once you are able to accurately match the dollars, donors, and donations that are both “raised” and “received,” you are ready to begin validating the rest of the dashboard. Experiment by changing the filters that narrow your results by date range(s), fiscal year vs. year-to-date dollars, categories, and any other criteria contained in the dashboard filter to “spot-check” the accuracy of your results. Be sure to look at the information contained in the second tab of the dashboard called “Additional Details.” Any criteria entered into the filter should apply to both of the dashboard tabs.
Troubleshooting:
Have you confirmed that you are sending comprehensive giving files?
How recently has your data been refreshed with EverTrue?
Are the values contained in drop-down filters what you expect to find? (Meaning, were they mapped correctly?)
Once Fundraising Analytics is validated, we recommend that the entire data validation team starts working together. For the rest of the giving reports, both the giving data expert and the annual giving expert should begin experimenting with all of the other giving reports. Your prospect data expert can begin their work on the prospect dashboards at the same time. (Those dashboards are listed later in this guide.)
Annual Giving Dashboards
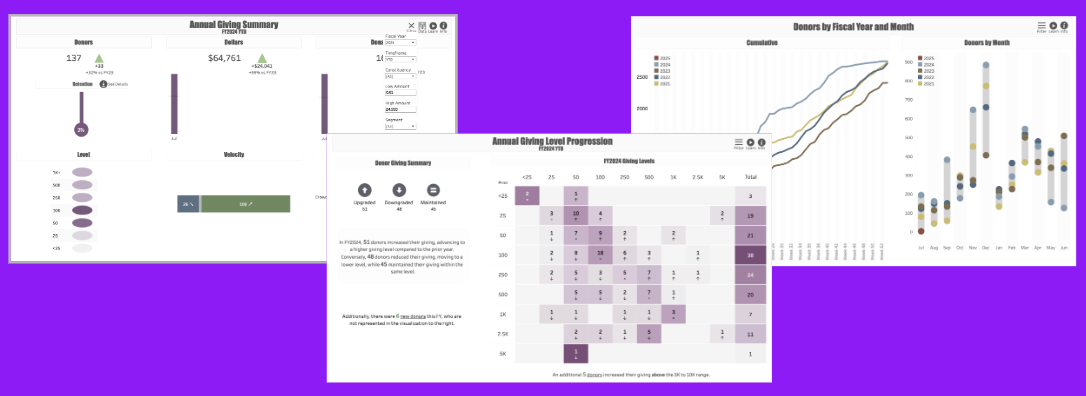
Once the Fundraising Analytics dashboard is accurately matching your CRM data, the annual giving dashboards should be accurately reflecting your giving information. Each of the dashboards uses its own selection criteria and default filter set, so please be sure you are aware of the criteria underlying each report. For example, the Annual Giving Summary report is configured to limit results to gifts below $25,000. (You can change that default any way you wish.)
We ask that you review the following giving dashboards to confirm they are all rendering correctly: Annual Giving Summary, Annual Giving Level Progression, and Donors by Fiscal Year and Month. For each of these dashboards, please work with the annual giving expert to do the following:
Watch the video tour under the “Learn” button.
Spot check the accuracy of the data filters to make sure they are returning the right results. Change things like date ranges, fiscal year vs. YTD reporting, dollar amount ranges, constituent types, etc. For the dashboards that allow you to download data, please download the results of a few separate filter options and make sure you can download and access the underlying giving data, and that the filters were applied to the downloaded results.
Be sure to move your cursor over the various visual elements to ensure that the data shown in the pop-out window is accurate. When those windows include links, make sure the links navigate to the appropriate location in Signal.
When you see things that you would like to adjust with your institution’s dashboards, please let us know. When you see opportunities for the dashboard to be better for all customers, please submit those ideas to us by clicking “Submit an Idea” at the bottom of the Info section of the dashboard. We truly appreciate your ideas and feedback!
Part 3: Validating Prospect and Proposal Dashboards
Prospect data typically varies a lot from institution to institution, so it is likely that your prospect dashboards won’t render as you would like them right out of the gate. Please let us know when this happens. There are many ways we can address your institutional needs through mapping, filtering, etc.
Fundraising operations can vary greatly in how they manage prospect assignments, moves management, and proposal management. Do you assign leads before they are qualified? Do you assign leadership giving prospects as well as major gift prospects? Do you create proposals for major gifts only, or are there proposals at the leadership annual fund level? These factors make a big impact on how your visualizations appear. We are happy to work with you to figure out how to modify the mapping or filters to help you get the results you need quickly.
The two dashboards we ask you to check rigorously are Portfolio Engagement and Proposal Pipeline. Once the data being returned from these dashboards matches what’s in your CRM (same contact report results, same proposal values, etc.), you can validate the other dashboards more quickly.
Portfolio Engagement
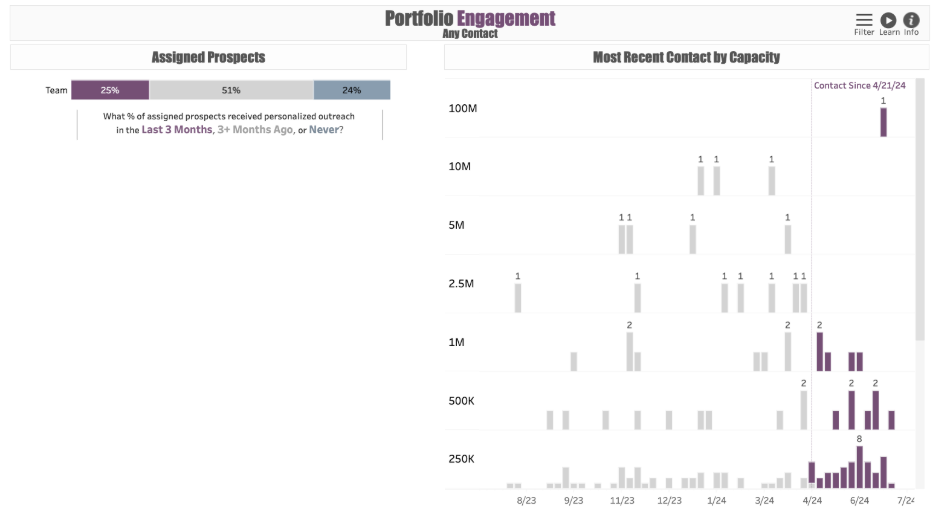
Open the dashboard filter and change the display to show “Count” versus “Percent.” In the “Assigned Prospects” visual, the total number of prospects displayed at the end of the bar chart should be equal to the number of assigned prospects in your CRM. Do these numbers match?
Now look at the number of assigned prospects contacted within the last 3 months, which is the number displayed in the purple section of the “Assigned Prospects” bar. Does the total number of interactions with assigned prospects over the last three months match those logged in your CRM?
Change the filter from “Any Contact” to “Substantive Only.” If you capture data on “Substantive Contacts,” does the number of substantive contacts over the last three months match the number in the purple section? If you don’t capture “Substantive Contact” data, does the number of contacts in the purple section match the total number of in-person and virtual meetings within the last three months?
Now change the “Team” filter to select a single team. Does the number of assigned prospects shown (at the end of the bar) match the number of prospects assigned to that team?
Change the filter view from “Summary” to “Detail.” Now you should be able to see the individual prospects captured in the “Most Recent Contact by Capacity” section on the right when you move your cursor over the marks along the timeline. Looking at the top three or four lines, do the prospect capacity values match those in your CRM?
Troubleshooting:
How recently has your Clarity data been refreshed?
Are the filters returning the same options that you would like to see? For example, does the “Team” filter include the fundraising teams you wish to track?
When pulling the data in your CRM, be sure you are only pulling interactions for assigned prospects.
When configuring the sync between your CRM and EverTrue, please make sure that prospects only have one active assignment that is “primary” and that all other assignment categories are listed as “secondary.”
When bringing over the solicitor interaction data, we recommend removing any non-solicitors, if possible.
Proposal Pipeline
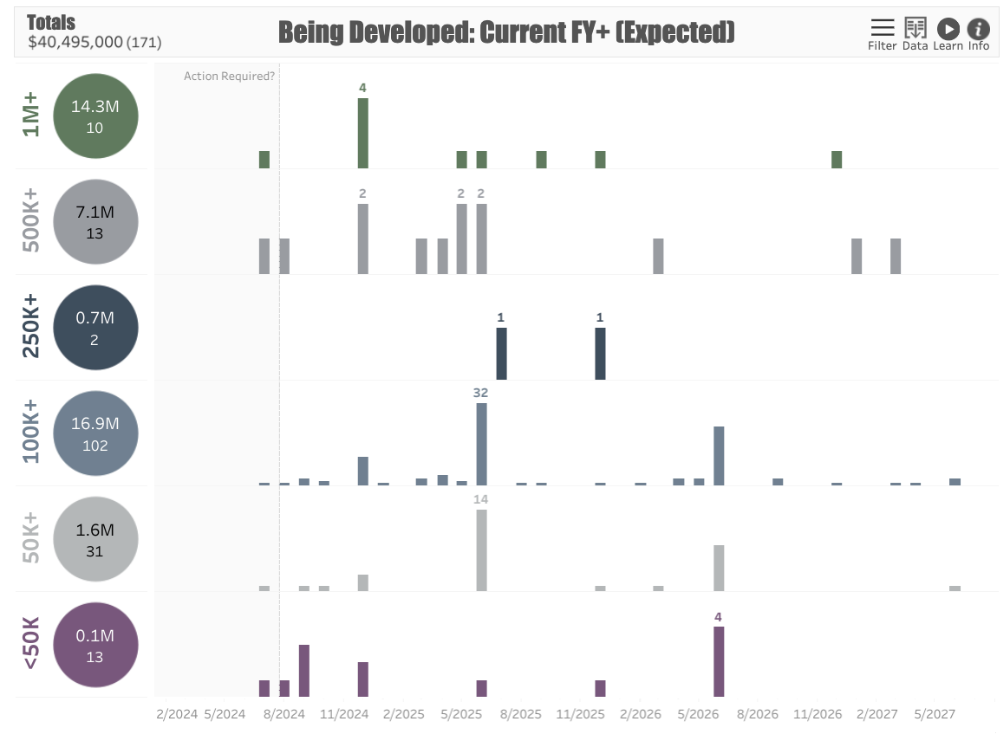
Open the dashboard filter and select the view “Being Developed and Pending: All.” This displays all of the proposals/opportunities that are either planned to be solicited or are awaiting a prospect response. In the upper left corner, you will see a dollar value as well as a number in parenthesis next to it. The dollars should equal the total value of asks that are either being planned or awaiting a response. The number should equal the total number of these proposals that are “in play.” Do these numbers match those in your CRM?
In the filter where it says “Solicitor,” de-select the value marked “All” and then select a single major gift officer whose portfolio is familiar to you. Now look in the upper left corner: does the total dollar value and opportunity count match what is in your CRM for that particular fundraiser’s asks that are “in play”?
Re-select the checkbox for “All” solicitors and then choose a single unit. Again, check the upper left corner to ensure that the total dollars and number of opportunities matches what you expect for that unit.
Change the filter view to “Pending Response: All.” Now move your cursor toward a line in the visualization to see a specific proposal. Is that proposal currently awaiting a prospect’s response? Does the rest of the information such as dollar amount, solicitor, expected date, etc. match your internal records?
Continue to change filters and hover over specific proposals about five more times. Make sure that in each case, the information that appears when you put your cursor over the visualization matches the specific proposal in question.
Troubleshooting:
How recently has your Clarity data been refreshed?
When configuring the sync between your CRM and EverTrue, please make sure that prospects only have one active assignment that is “primary” and that all other assignment categories are listed as “secondary.”
To see results more easily, click on the “Data” icon in the upper right corner after you apply your filter criteria. From there, download the data into an Excel or CSV file to view the individual proposals along with their assigned solicitors, unit codes, type codes, etc. This will make it easier to confirm that the data is accurate.
Other Prospect Dashboards
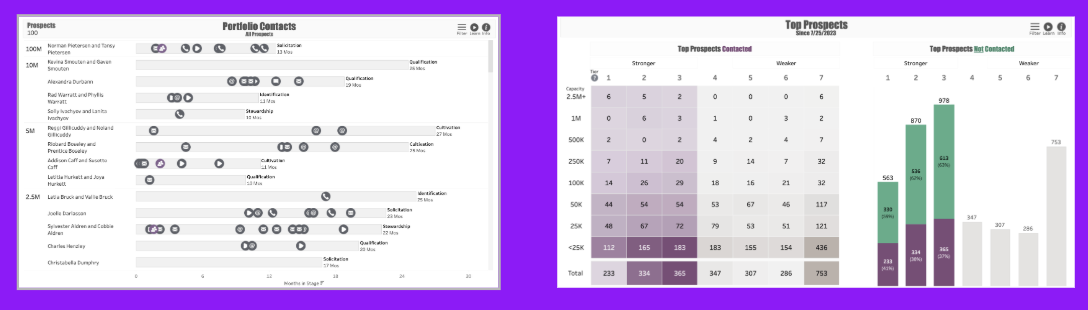
Once the Portfolio Engagement and Proposal Pipeline dashboards are accurately matching your CRM data, the other prospect dashboards should be accurate. We ask that you do a spot-check review of your other prospect dashboards to confirm they are rendering correctly: Portfolio Contacts and Top Prospects. For each of these dashboards, please do the following:
Watch the video linked to the “Learn” button.
Check that the filters returning the results you expect. For example, are stages, and assignments accurately reflecting the data in your CRM? When you have sent us your own prospect capacity ratings, are those the ratings that the dashboard is presenting? (Signal data will be used to calculate an estimated capacity when prospects do not have a research-derived rating.)
Are you able to download your results? Some dashboards put a defaulted limit to the number of records they will return. To change this, change the “Default” in your dashboard filter to include all of the records you wish to see.
Put your cursor over the visual elements. Is the information in the pop-out window accurate? If the windows contain links, are they navigating you correctly to the right place in Signal/Clarity?
When you see things that you would like to adjust with your institution’s dashboards, please let us know. When you see opportunities for the dashboard to be better for all customers, please submit those ideas to us by clicking “Submit an Idea” at the bottom of the Info section of the dashboard. We truly appreciate your ideas and feedback!
Troubleshooting:
How recently has your Clarity data been refreshed?
When configuring the sync between your CRM and EverTrue, please make sure that prospects only have one active assignment that is “primary” and that all other assignment categories are listed as “secondary.”
DPS scores are contained within Signal as opposed to your CRM, so don’t worry if your CRM isn’t able to break those out. Since they “live” in Signal, they are already validated.
Reply
Content aside
- 4 mths agoLast active
- 57Views
-
1
Following